Throughout history, there are examples of great business leaders who, despite their best efforts, experienced poor company performance. How is this possible? Also, when employees are asked the question, “Why is your company struggling?” the top responses usually are something like “poor communications” or “departments not working together” or “our improvements don’t seem to be sustainable.” Why are these issues so difficult to address? The answer to both of these questions may be found in understanding the demand/capacity curve.
Determine Maximum Capacity
Let us start our discussion by looking at capacity. The maximum capacity of your business is defined as the amount of goods or services that the slowest point in your process can produce (also known as the process bottleneck). In a manufacturing environment, for example, the bottleneck may be the output of a unique machine on the shop floor. If Machine X is the bottleneck and can produce 10 items an hour and runs 24 hours and 7 days a week, then the total output of the plant will be no more than 1680 per week (24 hours x 7 days x 10 items per hour).
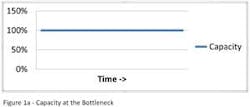
Remember to keep in mind that the bottleneck can be anywhere in the process. Maybe it is in engineering (how many drawings can be produced) or maybe it is in the supply chain (what is the output of the suppliers) or maybe it is in the customer service department (number of orders entered per day). For example, there may be a step in the order-entry process where a person is required to verify the order, check the credit status of the customer, and get a ship date from manufacturing. Let’s assume that this process step takes 10 minutes to complete per order and that each order has 2 items on it and that this person works 8 hours a day, 5 days per week. The output of this process will only be 480 items (8 hours x 5 days x 12 items). This is well below the output of our machine so in this case the bottleneck would be in the order-entry process and not in manufacturing. We can show the maximum capacity of the bottleneck on a chart as a line going forward in time at 100% (Figure 1a).
Creation of the Demand Curve
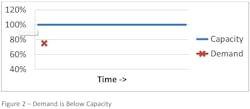
What happens when the demand for your company’s products or services is below the capacity line? This means we have plenty of extra capacity at the bottleneck operation and by definition, in every other process step as well. The people who work in operations tend to be a little more relaxed in this type of situation. They know that if something goes wrong, they can easily put things back on track by utilizing a portion of this extra capacity. So, if a part shows up late from a supplier, no big deal, we can fast track it through the factory and get it back on schedule. Or, if the person who is checking the orders wants to take half a day off, no problem… we can catch up tomorrow. The quality of the output also tends to be better, especially in a manual process, since people can take their time to do the work correctly. Also, with this lower demand, the workers are not being harassed by expeditors to get the orders completed quickly.
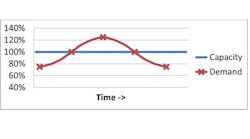
Imagine what a business leader staff meeting might sound like when the demand for their products or services is below the capacity line (Figure 2). The chief financial officer would probably start the meeting by saying, “Our revenue numbers are going to miss our goals for the quarter if we don’t do something quickly! The demand for our products is well below forecast and I am starting to get worried.”
“Hey, our sales folks are working their tails off, but our prices are too high compared to the competition” says the vice president of sales.
“Well, things are running very smoothly in operations. Our on-time delivery to our customer is the highest it has been in a while. We are also experiencing fewer quality issues, so our customers should be happy. Our overtime costs have come down quite a bit as well,” brags the director of operations.
“Hold on a minute,” chimes in the CFO. “Your operations team is not off the hook either. I have noticed that the labor and machine utilization metrics have been steadily declining. Maybe it is time to consider laying some people off. Also, since we are selling fewer products, our overhead costs per product sold are out of whack. We might need to start cutting overhead!” He of course says this while looking at all of the overhead sitting around the table.
“Calm down everyone,” the chief operations officer finally says. “We can work this out long before we need to start thinking about laying anyone off. It sounds to me like we can afford to lower our prices in order to fill up our factories. I know in the short term, this will eat into our profit margins, but we need to get our volumes up. You folks in sales also need to take advantage of the improved performance in operations. Maybe some sort of guarantee that we will ship it out on time. That should make our customers happy.”
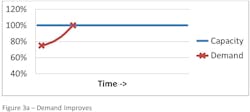
After the business leaders conclude their meeting, the vice president of sales convenes a meeting of his top sales people. “Those operations folks are making us look bad! They claim that we are not doing our job. So, let’s do an across-the- board price reduction and start advertising that we will guarantee that the products will be shipped out on time.” The sales folks leave the meeting satisfied since many of them are paid on commission, and they want to push as much product to the customer as possible. Due to these incentives, the demand begins to increase and the gap between demand and capacity begins to close (Figure 3a).
The chief operations officer, at the next business leaders meeting, is understandably pleased. “The sales team is really kicking things into high gear. Congratulations on getting our sales back on track. I know we had to give away a bit of our margins, but no one can argue with the results. If sales continue to grow, maybe we will actually hit our goals for the year.”
“Hmmm… Let’s look at your utilization percentages,” pipes in the chief financial officer. “It looks to me like the average machine and labor utilization is somewhere around 75%. That sounds to me like we still have quite a ways to go before there is an issue. You all in operations are always making things sound worse than they really are.”
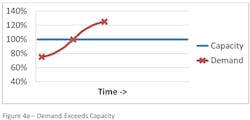
“Good. So, we are in agreement that I have the green light to keep the pressure on the sales team,” says the vice president of sales. So, demand continues to grow (Figure 4a).
“Wait a minute,” chimes in the VP of sales with a smug look on his face. “Earlier this year, you were bragging about how great your operations team was doing. Now, we give you some solid sales and you start complaining! You operations folks are never satisfied. Your plant’s performance is really starting to take a toll on our customers’ trust in our company. Dealing with the quality and delivery complaints is consuming a great deal of our sales force time. We have to give steep discounts to keep our customers from leaving us and that is not even working!”
Metrics Headed in Wrong Direction
“All I know is that our metrics are all going in the wrong direction,” says the chief financial officer. “Our sales are starting to flatten out, and are costs are going through the roof. The only metrics working in our favor are labor and machine utilization. We finally have the average utilization in the 95% range.”
“Yeah, the board is starting to ask questions,” says the chief operating officer. “We sure do seem to be having a stretch of bad luck. Just when our sales start to go up, our plant starts to have problems. We just can’t catch a break. Try to do all that you can to squeeze as much product out to keep our customers from leaving. Maybe we need to hire a couple of process improvement resources to help us figure out how to get our plant back on track.”
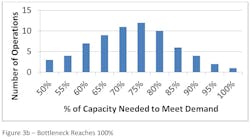
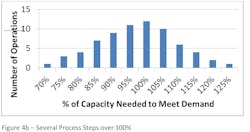
So, the director of operations hires some process improvement leaders and launches a new program to try and get things under control. They form several teams to study what might be going on and they decide to start by cleaning up the plant. Meanwhile, the number of processes with demand over 100% of the process Capacity has gone up significantly as shown by (Figure 4b).
“Finally… I did not have to work both Saturday and Sunday this past weekend,” the director of operations says with a sigh. “Things are finally beginning to settle down out in the factory. Our quality and delivery metrics are still not where they need to be, but we are starting to stop the bleeding. However, the workers out in the plant think we are a bunch of idiots since we just went through several months of mandatory overtime and now most of them don’t have much to work on.”
“Well, you try to sell something to a customer that just got burned. Most of them won’t even return my phone calls. And the ones that do return my calls want new guarantees or significant prices reductions. I think my sales folks spend more time pampering our old customers to keep them from leaving than they do trying to get new orders and that is hurting revenue as well.”
“We have got to do what we can to keep our old customers happy,” says the chief operating officer. “How are the process improvement efforts going?”
“The improvement teams are really just getting started. They painted the factory floor the other day,” says the director of operations. “The place is definitely looking less cluttered. But that may be due to having less product going through the factory. The jury is still out as far as how much impact this will have on our performance.”
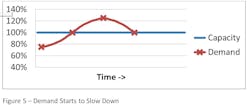
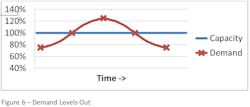
Demand continues to drop as customers send their business to companies that are able to meet their needs, and it takes several months for them to even consider using this company again. However, the operations team is able to show improvement in their performance metrics as demand drops below the capacity line. This and the fact that the sales force begins to shift their focus from firefighting problems to selling new products begins to bring customers back. So, our demand curve begins to flatten out (Figure 6).
“I am also starting to worry about the utilization numbers again too,” says the chief financial officer. “Since we are selling fewer products, our overhead costs are really going up as well. I am thinking we need to start cutting costs if we have any chance to hit our profit numbers.”
“Well, we could get rid of the process improvement people we hired a while back and disband the improvement teams since our numbers are so good,” says the director of operations. “That will bring our costs down pretty quick.”
“Ok. That sounds good,” says the chief operations officer. “We also need to boost sales by temporarily lowering prices and remember to tell our customers about our improved performance. Maybe, we should give them some sort of guarantee.”
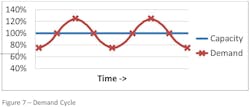
So another improvement effort comes to an end well before they have any real impact. The bottleneck operation continues to run at the same pace it did before since the teams have not even had time to identify where the bottleneck is in the process. The improvement efforts become the “Program of the Month” that will make the employees even more skeptical the next time this is tried. And the company is destined to repeat the demand curve over and over (Figure 7).
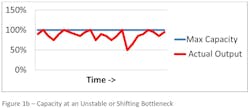
The time between the peaks may be several months or even a few years depending on the cycle time of the products or services being supplied. Also, the height of the peaks and the depth of the valleys may vary. So, the demand curve may not be as smooth as depicted in Figure 7. Also, earlier we saw that the capacity line can also vary, especially in an out of control process. This can make it difficult for the business leaders to understand what is happening to their business performance until it is too late.
Take Steps to Real Growth and Improvement
Step 1: Stabilize the Process Especially at the Bottleneck
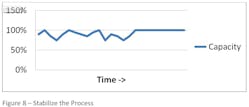
As we saw in figure 1b, it is difficult to understand what the maximum process capacity is if the process is unstable. If machines are shutting down unexpectedly or there are quality issues popping up or suppliers are late from time to time, then the maximum capacity could change from day to day or even hour to hour. So, there needs to be a solid preventive and predictive maintenance plan to lessen unplanned downtime, root-cause corrective actions to address quality issues and the use of statistical-process-control tools to lessen the chance of quality defects, and a solid supply chain strategy that includes setting up partnerships with the most critical suppliers to ensure that parts are being supplied when needed.
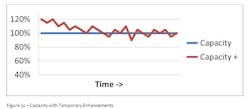
Step 2: Break the Bottlenecks
Step 3: Sales, Engineering, and Operations Work Together
Yes, it is possible for different departments and functions to work together. A good business leader in a company that wants to grow will promote a culture that embraces teamwork vs. individual success.
This can be done in a number of ways. First, the business leader needs to take a look at the way each of their staff are measured and what behaviors those measurements might promote. Next, by taking the steps already discussed, the business leadership team will have a better understanding of what the business processes are capable of producing. When processes are unpredictable, it is easy to point fingers of blame and create barriers between the departments. Instead, the business leaders need to focus on fixing their processes vs. blaming the people.
Another step the business leader could take to break down barriers between the functions is to change the organizational structure. Going to a “focus factory” type structure where the organization is aligned around products or processes vs. departmental functions, for example, will quickly break down many of these barriers.
The reason it is important for the various functions to work together is to help manage the demand/capacity curve. If the sales team knows how much capacity is available within the manufacturing process, then they could do a better job of managing the volume of sales.
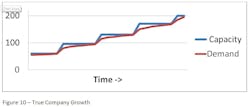
This might mean that they have to change the delivery promise dates as demand increases (and as the backlog increases) or maybe even turn some sales opportunities down. In one company, for example, the sales team sets the schedule and sells time slots of the bottleneck to make sure that the demand line never crosses the maximum capacity line. The on-time delivery of this company has stayed close to 100% since process was implemented (Figure 10).
Conclusion
Many companies have tried to implement lean and Six Sigma with mixed results. Some will start by cleaning up their factory and maybe even rearranging their process steps to form a continuous line of production. These companies may not know why they are doing these changes. For some, the focus is to reduce costs through lower work-in-process inventory levels. For others, they just want to check off the box that says that they have done lean and Six Sigma. Hopefully, after gaining an understanding of the demand/capacity curve, you (or your leadership team) will start to realize that the need to implement lean and Six Sigma is much deeper.
The Six Sigma tools are needed to help reduce the amount of variation that is occurring in your process. It is difficult to determine where the bottleneck is in your process or to determine what the capacity level is when your process is “out of control” and unpredictable. The lean tools are needed to help pinpoint the bottleneck, manage the flow through this step, and then figure out how to improve the capacity that will improve the output of the entire operation.
One of the difficulties is allowing enough time to implement these tools. Remember from our discussion that most “improvement” initiatives begin when things are going badly, at the top of the demand curve (Figure 4a). Getting a process under control so you can see where the bottleneck is may take several months if not a year or two for complex processes. By that time, the demand curve will probably be down in the valley (Figure 6) and the pressure to make the improvements will have gone away. Since this also means that costs start to become a problem, the easiest cost to cut is usually the improvement teams and training. It takes real discipline on the part of the business leaders to keep the improvement effort going.
Finally, it seems that business analysts could make good use of the demand/capacity curve when looking at a company. Questions that could be addressed at the annual shareholders meeting or during a quarterly review might be something like, “Can you share with us what the % capacity is of your bottleneck operation?” Or, “What steps are you taking to increase capacity at your bottleneck to promote growth?”
If the business leader does not know the answer to these questions, it could mean that the business processes are so unpredictable that the company’s performance could drop quickly as demand increases. Also, some companies brag about the amount of “backlog” they have (and their stock price seems to go up because of this). This may make the company look good in the short term since they will have steady work for a period of time. However, this also indicates they are well above their capacity line, and it is only a matter of time for their performance to come crashing down as indicated by the demand/capacity curve.
John Dyer is president of the JD&A – Process Innovation Co. and has 28 years of experience in the field of improving processes. He started his career with General Electric and then worked for Ingersoll-Rand before starting his own consulting company. Dyer can be reached at (704)658-0049 and [email protected]
