The Growth Equation: Four Levers for Increasing Your Innovation Throughput
If you work in the manufacturing industry, there’s a good chance your company is making a sizeable investment in new product innovation. U.S. companies alone invest over $280 billion in R&D annually—yes that’s billion with a B. We hear innovation success stories all the time from the Gods of innovation—companies like Apple and Google. But back here on this physical plane, it’s a different story with only 55% of companies seeing the kind of return they expect on that investment.
Remember the ancient Greek scientist Archimedes of Syracuse? In addition to that unfortunate bathtub incident, he discovered the principle of leverage. And while Archimedes originally conceived leverage as a mechanical concept, it turns out to have application in processes like new product innovation too.
There are four levers you can pull to increase your growth through new product innovation. These levers come together to make up our Growth Equation Framework:
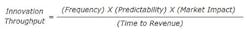
The four levers of the Growth Equation Framework are:
- Frequency or flowrate: The number of new product programs that you launch each quarter, year, etc.
- Predictability: The percentage of new products that you launch when initially promised and with all of the features initially requested.
- Time-to-Revenue: The cycle time it takes your new products to go from proposal to generating cash flow. Time-to-Revenue is in the denominator so it should be decreasing.
- Market Impact: The cash flow or throughput increase that your new products deliver or are expected to deliver.
Launch Frequency
Frequency measures how effective you are at bringing new products through all of the steps required for launch. The better you are at managing innovation resources and navigating the internal and external obstacles, the more new products you can launch each period.
The biggest impediment to flow or frequency that I run across in my consulting work is that too many companies fall into the trap of believing that they have to work on more projects to get more done. But once you reach the number of projects that delivers optimal flow, every project you add reduces the number that you can complete during a given period.
Multitasking is at the heart of the problem here. While pop-culture may laud the ability to multitask, it’s really one of the biggest productivity drains there is. This two-minute test should prove that to you.
Time how long it takes you to write out these two lines in sequence:
Task 1: RAPID NEW PRODUCT INNOVATIONS
Task 2: ABCDEFGHIJKLMNOPQRSTUVWXYZ
Task 1:____________________________________________________________
Task 2:____________________________________________________________
It probably took you anywhere from 10-20 seconds to complete each task for a total of 20 to 40 seconds.
Now let’s add multitasking. Start by writing one letter for Task 1 on the line below, then one letter for Task 2, then back to Task 1 and so on. The sequence should look like R,A,A,B,P,C,I,D,D,E,N,F…..
Task 1:____________________________________________________________
Task 2:____________________________________________________________
How long did it take this time? Most people take between 50% and 100% longer. And notice how uncomfortable it felt switching back and forth. The interruptions make it impossible to get into a rhythm or flow.
Now let’s look at an example applying this to your new product pipeline. Let’s say you have four opportunities in front of you and:
- All four are for equally important customers
- If you put your entire team on one project they can complete it in 3 months
- Each has the same return - $1M cashflow per quarter once complete
- Each project has an influential internal sponsor pushing to start ASAP
Now if you’re being completely honest with yourself, what are the chances that your organization wouldn’t spread the resources out and have someone working on each one? Here’s a one year snapshot of what that would look like with each project represented by a different color and W’s indicating wait time:
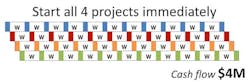
The Benefits of Focused Execution
Now I’ve had the occasional skeptic look at this and tell me that it’s too simplistic of a view. Fair enough, so here’s a real world example. When I recently started working with a multi-billion dollar OEM, I was initially told that they had nearly 100 major programs underway. Digging a level deeper, the data showed that only 30 to 40 of these programs were actively being worked on in any given month. It was the same thing we saw in the multitasking example. They were trying to keep all of the projects moving forward and as a result, wait time was overwhelming their ability to keep project flowing rapidly.
But wait, it’s worse than that. We already saw that multitasking made the work we did less effective. Even if we only assume a 33% reduction in output, the loss in effectiveness due to multitasking means it will actually take closer to 18 months to finish all four projects.
So let’s compare that to 18 months of focused execution with each project resourced for full speed.
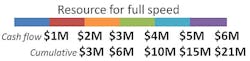
And that’s the power of launch frequency.
In the next part of the series we’ll tackle the second lever—predictability.

About the Author
Mike Dalton
Managing Director
Mike Dalton is the founder of Guided Innovation Group, where for nearly 20 years he has helped leaders in highly engineered product companies make new products a reliable competitive advantage. He has contributed numerous Industry Week articles and is the author of Unlocking Innovation Productivity and Simplifying Innovation.