Manufacturers Cite Health Care as Top Concern in NAM/IndustryWeek Survey
The fall months brought about a government shutdown, near default and the wildly incompetent implementation of the Affordable Care Act (ACA). These factors have created a significant and harmful level of uncertainty for manufacturers in the United States, so it is unsurprising that respondents to the Q4 2013 National Association of Manufacturers (NAM)/IndustryWeek Survey of Manufacturers had strong reactions to these topics. The survey results strongly state that the ACA has had a highly negative impact beyond the health care market, and manufacturers’ concerns are unlikely to fade.
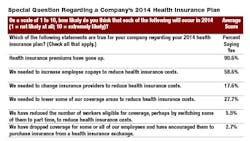
The numbers paint a picture of a health care system that has forced many manufacturers into making some difficult decisions. Most importantly, 90.6% of manufacturers said their health insurance premiums had increased (Table 1). Beyond that, some of these firms have also had to increase employee copays (58.6%), reduce coverage (27.7%) and/or change insurance providers (17.6%) to lower their costs. Even after taking these steps, the average increase in health insurance costs within the manufacturing sector for 2014 was 8.76%, with just more than three-quarters of respondents saying their increase was at least 5.0%.
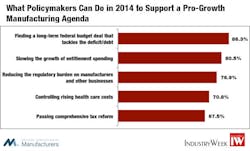
On the issue of fiscal spending, the most recent government shutdown zapped consumer and business confidence, and the prospect of yet another budget impasse in January creates more uncertainty in the marketplace. With that in mind, 86.3% of manufacturers want the president and Congress to find a long-term solution to the nation’s budgetary challenges—a top priority for 2014 (Figure 3).
Yet, after a rash of short-term solutions that have created a “Groundhog Day” effect regarding budget debates, business leaders remain skeptical that a deal that would insert longer-term certainty in the budget might take place. Manufacturers were asked to rank the probability of a series of possible fiscal events occurring in 2014 (Table 2), ranging from 1 being not likely to occur and 10 being extremely likely to occur. Overwhelmingly, respondents felt the most likely outcome of the current budget negotiations would be for a continuing resolution that extends the budget to the end of the fiscal year, with an average score of 7.35. In fact, more than 60% of respondents ranked such a probability an 8, 9 or 10. All other options for some sort of a bargain ranked much lower, with a “grand bargain” that includes comprehensive tax and entitlement reforms and eliminates budget sequestration scoring an average of just 2.40. Under that scenario, nearly 81% of manufacturers scored the probability of a “grand bargain” a 1, 2 or 3.
Conventional wisdom suggests that the probability of another government shutdown in January is low. Nonetheless, respondents have a pessimistic outlook on the outcome of the ongoing budget negotiations, scoring the likelihood of another government shutdown at an average of 5.76 and providing some downward risks to economic growth in early 2014. On a more positive note, respondents saw little likelihood that the federal government will default on its financial obligations when the government reaches its borrowing authority in February.
These results show a manufacturing sector that, like the general public, continues to be frustrated by Washington’s inability to deliver meaningful policy solutions that address the fiscal situation in the United States. While manufacturers hope for the best, they remain relatively skeptical of a solution in the near future.
Yet, while some surveys have shown rising confidence, weaknesses persist. Manufactured goods exports have risen by just 2.2% year-to-date relative to the same time period last year, and the gains in sales and output have not been as broad-based as we would like to see. Beyond that, hiring growth remains modest at best, with many manufacturers hesitant to add new workers.
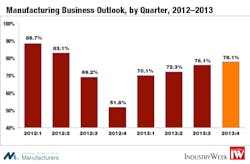
The NAM/IndustryWeek Survey of Manufacturers captures the mixed nature of the current economic landscape, which is both hopeful and cautious at the same time. On the positive side, the percentage of respondents saying they were positive about their own company’s outlook has edged another notch higher, up from 76.1% in September to 78.1% in December (Figure 4). The outlook measure has improved each quarter this year, and it was certainly better than the 51.8% who were positive at the end of last year as manufacturers prepared for the possibility of going off the fiscal cliff. Nonetheless, the sector remains below the optimism levels observed at the beginning of 2012 when manufacturing activity was more robust and 88.7% of respondents were positive in their outlook.
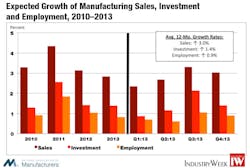
This slight pullback was also seen in the capital spending, employment and exports data. Regarding capital investments, manufacturers plan to increase their spending by 1.4% over the next 12 months, down from 2.1% last quarter. The difference stems from a slight increase in those now planning to reduce their capital investments over the next year, up from 12.1% in September’s survey to 15.9% in December. In both cases, more than 40% of respondents planned to increase their investments in 2014.
Even as other activity measures have accelerated in recent months, hiring plans have lagged. In fact, more than half of respondents do not plan to change their employment levels over the next year. Employment is expected to increase by just 0.9% in the next 12 months, down from 1.1% in September.
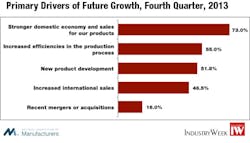
Exports will continue to be a major driver of growth for manufacturers, but the U.S. market is also extremely vital. When asked about the primary drivers of future growth, 73.0% said that a stronger domestic economy was the key to their strategic plans (Figure 6). At the same time, 46.5% of respondents cited increased international sales. Still, the outlook for export growth was diminished in this survey. Over the next 12 months, 39.2% of manufacturers expect higher exports in their firms, with an average increase of 1.2%. This was down from 1.4% growth in September’s report. We hope recent improvements in the economies of many of our key trading markets will allow our manufacturers to increase their global sales figures moving forward.
Manufacturers expect inventory levels to be essentially unchanged over the next 12 months, with the average down 0.2%. It has now been negative for six straight quarters. This could be good news if new orders gain strength. With reduced stockpiles, production will need to pick up to meet the stronger demand. Slower growth for prices will also help nudge additional demand. The average price increase anticipated for a company’s product line was 1.2% in this survey, up a bit from the 1.1% change in September’s survey but lower than the 1.5% predicted in March.
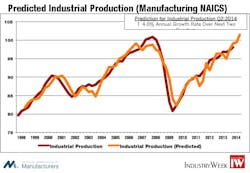
For several quarters now, we have used the NAM/IndustryWeek outlook data in a regression model to predict manufacturing production two quarters ahead (Figure 7). Other variables include housing permits, the interest rate spread, personal consumption and the S&P 500. This model explains roughly 89% of the variation since the data began in the fourth quarter of 1997.
The NAM/IndustryWeek Survey of Manufacturers has been conducted quarterly since 1997. This survey was conducted among NAM membership between November 15 and 27 following the government shutdown and the beginning of budget discussions, with 287 manufacturers responding. Responses were from all parts of the country, in a wide variety of manufacturing sectors and in varying size classifications. Aggregated survey responses appear below. The next survey is expected to be released on Monday, March 10, 2014.
Sample Comments
- “All growth is put on hold waiting for politicians to prove they are not going to push us into recession. We are weeding out the poorest performers and have stopped any hiring attempts. We are hunkering down until we get some adult leaders.” (primary metals)
- “Capital expansion largely outside the United States.” (paper and paper products)
- “Companies are paralyzed on capital spending.” (machinery)
- “Consumer confidence is down due to high unemployment and constant bickering in Washington.” (miscellaneous manufacturing)
- “Domestic oil and gas development and the increase in drilling are sources of strength and growth.” (primary metals)
- “EPA regulations.” (chemicals)
- “Government deficit and debt reduction on a long-term solution needed.” (primary metals)
- “Growth is difficult with the costs imposed by business. People won’t buy with all the uncertainty and added costs of Obamacare.” (plastics and rubber products)
- “We have had to increase the risk of a GAP plan to keep our premiums from skyrocketing. We have increased deductibles.” (wood products)
- “Increased health insurance costs due to requirement to cover ACA inclusion of additional and free services.” (plastics and rubber products)
- “Our health insurance company dropped us due to getting out of the small group plans market.” (primary metals)
- “Stronger local economy in Europe.” (plastics and rubber products)
- “Tier IV requirements for diesel engines are expected to cause a 50 percent decrease in sales of the affected models.” (machinery)
- “Unfair Chinese imports.” (primary metals)
-
“We are self-insured, but had to change our third-party administrator due to their ceasing operations as a result of increased demands of the Affordable Care Act.” (transportation
Survey Responses
The questions and responses for the Q4 2013 NAM/IndustryWeek Survey of Manufacturers are listed below, including the special survey questions on the Affordable Care Act and other policy issues.
-
How would you characterize the business outlook for your firm right now?
- Very positive – 12.2%
- Somewhat positive – 65.9%
- Somewhat negative – 19.9%
- Very negative – 2.1%
-
Over the next year, what do you expect to happen with your company’s sales?
- Increase more than 10 percent – 9.5%
- Increase 5 to 10 percent – 23.9%
- Increase up to 5 percent – 34.0%
- Stay about the same – 22.8%
- Decrease up to 5 percent – 4.9%
- Decrease 5 to 10 percent – 2.5%
- Decrease more than 10 percent – 2.5%
Average expected increase in sales consistent with these responses = 3.0%
-
Over the next year, what do you expect to happen with prices on your company’s overall product line?
- Increase more than 10 percent – 0.7%
- Increase 5 to 10 percent – 5.3%
- Increase up to 5 percent – 38.6%
- Stay about the same – 49.1%
- Decrease up to 5 percent – 4.9%
- Decrease 5 to 10 percent – 0.7%
- Decrease more than 10 percent – 0.7%
Average expected increase in prices consistent with these responses = 1.2%
-
Over the next year, what are your company’s capital investment plans?
- Increase more than 10 percent – 13.7%
- Increase 5 to 10 percent – 11.3%
- Increase up to 5 percent – 16.5%
- Stay about the same – 42.6%
- Decrease up to 5 percent – 3.9%
- Decrease 5 to 10 percent – 2.8%
- Decrease more than 10 percent – 9.2%
Average expected increase in investment plans consistent with these responses = 1.4%
-
Over the next year, what are your plans for inventories?
- Increase more than 10 percent – 1.4%
- Increase 5 to 10 percent – 4.5%
- Increase up to 5 percent – 16.1%
- Stay about the same – 54.5%
- Decrease up to 5 percent – 15.7%
- Decrease 5 to 10 percent – 4.5%
- Decrease more than 10 percent – 3.1%
Average expected increase in inventories consistent with these responses = -0.2%
-
Over the next year, what do you expect in terms of full-time employment in your company?
- Increase more than 10 percent – 0.7%
- Increase 5 to 10 percent – 8.0%
- Increase up to 5 percent – 28.6%
- Stay about the same – 51.9%
- Decrease up to 5 percent – 7.0%
- Decrease 5 to 10 percent – 2.4%
- Decrease more than 10 percent – 1.4%
Average expected increase in full-time employment consistent with these responses = 0.9%
-
Over the next year, what do you expect to happen to employee wages (excluding nonwage compensation such as benefits) in your company?
- Increase more than 5 percent – 1.1%
- Increase 3 to 5 percent – 14.4%
- Increase up to 3 percent – 66.2%
- Stay about the same – 17.3%
- Decrease up to 3 percent – 0.4%
- Decrease 3 to 5 percent – 0.4%
- Decrease more than 5 percent – 0.4%
Average expected increase in wages consistent with these responses = 1.6%
-
Over the next year, what do you expect to happen with the level of exports from your company?
- Increase more than 5 percent – 10.5%
- Increase 3 to 5 percent – 14.0%
- Increase up to 3 percent – 14.7%
- Stay about the same – 56.8%
- Decrease up to 3 percent – 1.4%
- Decrease 3 to 5 percent – 0.7%
- Decrease more than 5 percent – 1.8%
Average expected increase in exports consistent with these responses = 1.2%
9.What are the primary drivers of your company’s future growth strategies?
(Respondents were able to check more than one response; therefore, responses exceed 100%.)
a. Increased efficiencies in the production process – 55.0%
b. Increased international sales – 46.5%
c. New product development – 51.8%
d. Recent mergers or acquisitions – 16.0%
e. Stronger domestic economy and sales for our products – 73.0%
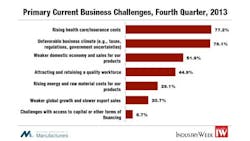
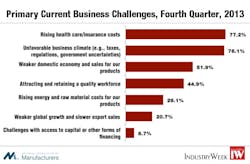
10. What are the biggest challenges you are facing right now?
(Respondents were able to check more than one response; therefore, responses exceed 100%.)
- Attracting and retaining a quality workforce – 44.9%
- Challenges with access to capital or other forms of financing – 6.7%
- Rising energy and raw material costs for our products – 29.1%
- Rising health care/insurance costs – 77.2%
- Unfavorable business climate (e.g., taxes, regulations, government uncertainties) – 76.1%
- Weaker domestic economy and sales for our products – 51.9%
- Weaker global growth and slower export sales – 20.7%
11. What is your company’s primary industrial classification?
- Apparel and allied products – none
- Beverages and tobacco products – 0.7%
- Chemicals – 7.0%
- Computer and electronic products – 2.4%
- Electrical equipment and appliances – 4.2%
- Food manufacturing – 2.4%
- Furniture and related products – 0.7%
- Leather and allied products – none
- Machinery – 11.5%
- Miscellaneous manufacturing – 16.0%
- Nonmetallic mineral products – 2.1%
- Paper and paper products – 1.4%
- Petroleum and coal products – 1.0%
- Plastics and rubber products – 10.8%
- Primary metals or fabricated metal products – 29.6%
- Printing and related activities – 2.4%
- Textile mills or textile products – none
- Transportation equipment – 4.9%
- Wood products – 2.8%
12. What is the size of your firm (e.g., the parent company, not your establishment)?
- Fewer than 50 employees – 25.1%
- 50 to 499 employees – 51.2%
- 500 or more employees – 23.7%
Special Questions: Affordable Care Act and Other Policy Issues
-
Which of the following statements are true for your company regarding your 2014 health insurance plan? (Check all that apply.)
- Health insurance premiums have gone up – 90.6%
- We needed to increase employee copays to reduce health insurance costs – 58.6%
- We needed to change insurance providers to reduce health insurance costs – 17.6%
- We needed to lower some of our coverage areas to reduce health insurance costs – 27.7%
- We have reduced the number of workers eligible for coverage, perhaps by switching some of them to part time, to reduce health insurance costs – 5.5%
-
We have dropped coverage for some or all of our employees and have encouraged them to purchase insurance from a health insurance exchange – 2.7%
14. Have you had your current insurance coverage cancelled or altered due to the implementation of the Affordable Care Act?
- Yes – 72.8%
- No – 18.6%
- Uncertain – 8.6%
- What is the change in your total health costs for 2014, assuming you know this amount?
- 15.0 percent or more increase – 23.0%
- 10.0–14.9 percent increase – 17.8%
- 5.0–9.9 percent increase – 35.2%
- Increase of up to 4.9 percent – 15.2%
- No change or a slight decrease – 5.7%
- Decrease of up to 4.9 percent – 1.3%
- 5.0 percent or more decrease – 1.7%
(Average increase for 2014 health insurance costs = 8.76%. Note that the percentage responses did not include those who were uncertain about their health insurance costs for next year. In all, 17.6 percent of respondents marked “uncertain” on this question.)
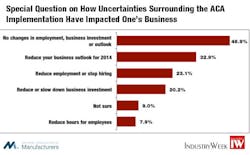
- Have uncertainties surrounding the implementation of the Affordable Care Act caused you to do any of the following? (Check all that apply.)
- Reduce employment or stop hiring – 23.1%
- Reduce hours for employees – 7.9%
- Reduce or slow down business investment – 20.2%
- Reduce your business outlook for 2014 – 32.9%
- No changes in employment, business investment or outlook – 46.9%
-
Not sure – 9.0%
17. What do you see as the top challenges for policymakers in 2014? (Check all that apply.)
- Slowing the growth of entitlement spending – 80.5%
- Finding a long-term federal budget deal that tackles the deficit/debt – 86.3%
- Passing comprehensive tax reform – 67.5%
- Ending expansionary monetary policy actions – 37.9%
- Reducing the regulatory burden on manufacturers and other businesses – 76.9%
- Expanding economic opportunities with more trade agreements – 19.5%
- Implementing a true “all-of-the-above” energy policy – 41.2%
- Controlling rising health care costs – 70.8%
- Addressing the skills gap facing manufacturers – 35.4%
- On a scale of 1 to 10, how likely do you think that each of the following will occur in 2014 (1 = not likely at all; 10 = extremely likely)?
- There will be another government shutdown in January. (average score = 5.76)
- The United States will default on its debt obligations in early 2014 after the debt ceiling is not increased. (average score = 3.01)
- The President and Congress agree to a “grand bargain” that includes comprehensive tax and entitlement reforms and eliminates budget sequestration. (average score = 2.40)
- The President and Congress agree to a smaller bargain that eliminates some or all of the budget sequestration cuts in exchange for some degree of entitlement reform. (average score = 4.31)
- The President and Congress agree to a smaller bargain that eliminates some or all of the budget sequestration cuts in exchange for some degree of tax reform. (average score = 4.28)
- The President and Congress are not able to come to any budget agreement beyond extending the continuing resolution to the end of the fiscal year (September 30). (average score = 7.35)
About the Author

Chad Moutray
Chief Economist, National Association of Manufacturers
Chad Moutray is chief economist for the National Association of Manufacturers, where he serves as the NAM’s economic forecaster and spokesperson on economic issues. He frequently comments on current economic conditions for manufacturers through professional presentations and media interviews and has appeared on various news outlets. In addition, he is the director of the Center for Manufacturing Research at The Manufacturing Institute, the workforce development and education partner of the NAM, where he leads efforts to produce thought leadership, data and analysis of relevance to business leaders in the sector.
Prior to joining the NAM, Mr. Moutray was the chief economist and director of economic research for the Office of Advocacy at the U.S. Small Business Administration from 2002 to 2010. In that role, he was responsible for researching the importance of entrepreneurship to the U.S. economy and highlighting various issues of importance to small business owners, policymakers and academics. In addition to discussing economic and policy trends, his personal research focused on the importance of educational attainment to both self-employment and economic growth.
Prior to working at the SBA, Mr. Moutray was the dean of the School of Business Administration at Robert Morris College in Chicago (now part of Roosevelt University). Under his leadership, the business school had rapid growth, both adding new programs and new campuses. He began the development of an M.B.A. program that began accepting students after his departure and created a business institute for students to work with local businesses on classroom projects and internships.
Mr. Moutray is the vice chair of the Conference of Business Economists, and he is a former board member of the National Association for Business Economics, where he is the co-chair of the Manufacturing Roundtable. He is also the former president and chairman of the National Economists Club, the local NABE chapter for Washington, D.C.
He holds a Ph.D. in economics from Southern Illinois University at Carbondale and bachelor’s and master’s degrees in economics from Eastern Illinois University. He is a Certified Business Economist™, where he was part of the initial graduating class in 2015.
In 2014, he received the Outstanding Graduate Alumni Award from EIU, and in 2015, he accepted the Alumnus Achievement Award from Lake Land College in Mattoon, Illinois, where he earned his associate degree in business administration. He serves on the external economics advisory board for the SIUC’s School of Analytics, Finance and Economics.