Measuring Up: Using Lead-time Metrics for Next-Generation Lean

The points made in the first three articles in this seven-part series on Next Generation Lean include the following;
- Lean’s current focus on reducing Cost-of-Goods-Sold waste needs to be expanded to cover all waste associated with Order Fulfillment.
- Introducing an overriding strategy of lead-time reduction to Lean practice will change it from a methodology that produces isolated tactical impacts to one that delivers more comprehensive strategic transformation.
- An industry-wide customer-focused metric for lead-time needs to be adopted to support strategic Lean practice.
- Market specific—customer-based lead-time expectations and competitor Order Fulfillment proficiency—Build-to-Demand capability is a company’s Lean end game.
- Such a lead-time metric could then be used to quantify a company’s current Lean status, as well as to define what it means for a specific company to be considered Lean. The difference between their current Lean status and their Lean end game goal quantifies a Lean-ness gap, finally giving Lean practitioners a concrete way to say where a company is in its Lean journey.
This column will introduce a lead-time metric that has seen 20 years of successful application in industry and fits-to-a-T what is needed for Next Generation Lean.
Before getting into the details of the lead-time metric being proposed, it is important to lay out two significant aspects related to the above points. Namely, that with Lean’s focus now being on Order Fulfillment—with a target of market specific Build-to-Demand capability—distribution and sourcing lead-times are now important factors to a company’s overall Lean-ness! Specifically this means that a company’s Order Fulfillment lead-time now includes the time involved in ordering/receiving purchased product into their own factory, as well the time involved in moving it out through their distribution channel into customer hands. So, under Next Generation Lean, lead-times—and Lean-ness—are no longer based solely on a company’s own in-factory operations.
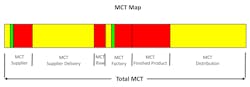
This inclusion of suppliers and distribution in Order Fulfillment lead-time is shown pictorially later in this article. Right below that picture is a timeline representation of the corresponding lead-time metric. Take a look at both the picture and timeline now, disregarding the colors and “MCT” term for now—which will be explained shortly. These visuals show that as far as Order Fulfillment lead-time is concerned, both suppliers and distribution can (and usually do) have an enormous negative impact on a company’s ability to service their customers. And isn’t servicing customers what the Lean big picture is supposed to be all about?
You might dispute the above. I personally know a lot of people in the purchasing profession that would and do. They tend to ignore Total Cost and instead have a sole focus on chasing lower piece-prices. To support my position I’ll refer back to Toyota, whose practices formed the original basis for Lean. Toyota (and most Japanese automobile manufacturers, for that matter) has long employed what is called Keiretsu supplier management. One of the features of Keiretsu is that suppliers are required to locate local to the factories they supply. One of the reasons for imposing this condition is that it all but eliminates supplier resupply transportation times.
In Japan, Keiretsu means suppliers being located “down the block” within a mile or two of the factory they are supplying. In the U.S. —which has by far a larger geographic footprint—Keiretsu has been translated to having suppliers located within four hours of a consuming factory. Ten years ago I had the opportunity to participate in a supply management benchmarking exchange between my employer and a U.S.-based Japanese automobile manufacturer. During that session they revealed that 96% of their annual spend was with suppliers located within a hundred miles of their factory! There is a lesson here for Lean, I think.
Another lesson that can be taken from Toyota (and Japanese automobile manufacturers, in general) is relative to where they locate their assembly factories. The United States is the world’s largest consumer market for automobiles. To reduce product distribution times Toyota has located their plants that service the U.S. market to North America (Canada, the U.S. or Mexico). This takes approximately six weeks off of the time needed to deliver product to their dealers, compared to what would be needed if the cars were manufactured overseas. One of the important Order Fulfillment efficiency metrics used in the automotive industry is the Finished Product Days-On-Hand at Dealerships needed to support acceptable Customer Fill Rates. Historically, Toyota has been able to keep roughly one-half of such inventories as compared to U.S. automobile manufacturers. This represents a significant cost savings.
How do they do it? They’ve eliminated the six-week distribution disadvantage they would have if they manufactured in Japan and reduced almost all of their supply chain resupply transportation times down to less than one day. Compare this to what U.S. automobile manufacturers have done. By chasing the lower piece-prices (sometimes) available overseas they have imposed upon themselves a six-week resupply lead-time disadvantage. That leads to needing more pre-built/pre-positioned Finished Goods Inventory at Dealerships to support the needed Customer Fill Rates. Another way of looking at it is that OEMs with extended supply chains have about the same Order Fulfillment flexibility as if they assembled their product overseas and shipped it to the U.S afterwards. I think there is a lesson for Lean here, too.
Even though you need to read between the lines to see Toyota’s overall Order Fulfillment focus, it is pretty clear that their manufacturing strategy (including supply chain and distribution) has always taken into account the total time that it takes to service their customers. The question that comes to mind—since Lean was based on Toyota manufacturing practices—is how standard Lean practice in the U.S. and elsewhere missed taking overall Order Fulfillment times into account. Next Generation Lean—and the metric to be proposed—do.
MCT as a Universal Metric for Order Fulfillment Lead-Time
Manufacturing Critical-path Time (MCT) is defined as: “The typical amount of calendar time from when a manufacturing order is created through the critical-path until the first, single end-item of that order is delivered to the customer.”
There is a lot of power in this definition, including:
- It reflects “true” lead-times due to its critical-path focus, in which pre-built/pre-positioned inventories (raw, in-process, or finished product) are translated to lead-time elements.
- It is based on what end-use customers care about when ordering product—calendar time, i.e., how long they’ll have to wait. I’ve never met a customer who cared a bit about factory takt times, or for that matter, even knew what the term meant. Not that takt time isn’t a useful tool but it certainly isn’t a metric that can is easily translated to customer satisfaction.
- Associating delivery with a single end-item penalizes batches that are above and beyond current customer demand. The larger the batch size the larger lead-time penalty—batch sizes above current demand do not lower product cost, which is a concept that industrial engineers have been trying unsuccessfully for generations to get across to accountants.
- Delivery to the customer means that manufacturing isn’t done until Order Fulfillment is complete. Again, this ties MCT directly to customers.
- MCT can be applied to both micro- and macro-situations. MCTs are, in fact, additive such that once product flows and/or value streams are defined, they can be broken down into MCT values for each of the necessary individual operational segments. Yet, the individual operational MCTs can then be consolidated to quantify a “true” overall lead-time from raw material all of the way to customer satisfaction.
- To use this metric, activities are prioritized based on their projected impact on reducing product MCT, period, end-of-discussion. Why? Because it consolidates the impact of individual Lean events such that they are no longer isolated. A reduced product MCT can be directly tied to improving currently accepted executive level metrics, which means project savings are both quantifiable and recognized
One question I get a lot is whether measuring “true” lead-time in days is discrete enough for an efficiency metric. In a word, I believe the answer is “yes.” My experience with MCT shows that most end-use products and/or value streams—depending on their complexity—have MCTs of months or (at best) weeks. This means that using days to quantify the metric provides sufficient precision. It also means that if you can’t reduce MCTs by days or weeks, you are either very Lean or aren’t really working on what you need to be. Finally, using days as the basis for MCT overcomes the urge to engage in analysis paralysis, something current Lean practitioners are often accused of.
Quantifying MCT
I’ll start out with a warning here: Do not use data from your MRP or any other scheduling system to quantify MCTs. This advice is based on experience with hundreds of MCT values where very few were found to accurately relate to scheduled times.
So how do you quantify the metric? Simply stated, an MCT map is a visual timeline of a job experience as it winds its way through its processing critical-path. Some academics show this in “white” wait-times and “grey” touch-times. I prefer defining and showing Value Added (processing) times as green; Non-Value Added but Necessary times as yellow (to differentiate true waste from necessary activities like set-ups); and Non-Value Added-Unnecessary (wait) times as Red. Why? For two reasons. First, the color scheme aligns with something everyone can identify with—traffic lights—and what they mean, i.e., green is good, yellow is not so good, and red is bad. So there is no confusion regarding what the color of a segment of MCT implies. Second, as a former executive I think I can safely say that the best way to effectively communicate with managers is through pictures. And if you really want to get your message across to them, color the pictures! So a black-and-white spreadsheet—or for that matter a white-and-grey visual timeline—does not adequately convey the information to the people you need to support your efforts as well as a colored one. Here’s an example of what both a processing flow and an MCT map look like.
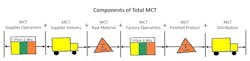
As you can see and as previously pointed out, inventories are translated to MCT segments, i.e., they add to, rather than reduce, overall MCT. Also, as will be discussed extensively in the next article of this series, the “Components of Total MCT” visual looks a lot like a Value Stream Map, doesn’t it?
An MCT is created by having operators record the “start” and “stop” times of the operations needed to produce a product, including supply chain and distribution. Industrial engineers traditionally have worked on improving machine rate (Value Added) and reducing set-up (Non-Value Added but Necessary) times. When creating MCT maps of your products you’ll likely find that these two colors represent a very small proportion of its overall MCT. It is actually the times between operations (Non-Value Added-Unnecessary)—from the end of one operation to the beginning of the next—that will dominate the timeline on most MCT maps.
One question that often comes up is, “How can you base a metric on a single sample size?” i.e., tagging a single job. I agree this can be an issue if you don’t tag normal operations, for instance, if the MCT tagging was conducted on a “rush job.” Otherwise, I’ve found there is usually very little variation in tagging output between jobs, i.e., usually under 10%. I also believe that over time factories should routinely verify their product’s current MCT status through regular tagging—it really doesn’t take much effort once it’s set up.
A significant point needs to be made relative to MCT reduction. Namely, MCT reduction will impact the targeted executive level metrics regardless of the color of the MCT lead-time element that is reduced. Because of this the most impactful projects typically focus on reducing the red Non-Value Added-Unnecessary time segments since they offer the most potential for reduction! Yellow Non-Value Added but Necessary time segments typically offer the next highest potential for improvement. Related to this is the observation that green Value Added processing areas are usually already highly engineered, meaning that it will take new or revised production equipment and/or processes to reduce the time in that portion of an MCT. And in fact, since generations of industrial engineers have spent time focusing on the green, Value Added processing is usually relatively efficient. As a sidenote, isn’t it interesting that the focus of much industrial engineering work over the last 100 years has been on the (much) smaller portion of what impacts those executive level financial metrics?
Another point to be made is that the red Non-Value Added-Unnecessary portion of a product’s MCT is synonymous with waste in Next Generation Lean. By focusing on the red MCT segments, a Next Generation Lean practitioner is actually focusing on reducing waste—the basis of Lean practice. But it is the waste that has the highest potential for improving executive level metrics. I will tell you that in executive circles it has been my experience that top managers have become somewhat inured to the term waste—probably since Lean waste reduction has been difficult to tie to the operational metrics they get measured on. But I haven’t ever run into a manager and/or owner that wouldn’t aggressively support reducing Non-Value Added-Unnecessary times. I know, I know, theoretically they are the same, but from a practical point-of-view use of the Non-Value Added-Unnecessary term seems to be more effective in garnering executive level support.
Once you have collected the “start” and “stop” times from your tagging exercise you’ll use them to construct a MCT map like the one shown previously. The difference here is that in a normal industrial engineering time study the primary focus is on the processing time, but here the focus is on the time between when one step ends and the point where the next step starts, i.e., the low hanging fruit. In Next Generation Lean all reduced times—whether Value Added or Non-Value Added (Necessary or Unnecessary)—have equal impact on overall MCT so, in looking for high impact Lean activities, you should pursue the low hanging fruit which is usually the red Non-Value Added-Unnecessary MCT elements.
Online MCT mapping tools are available and they are good at both showing and quantifying available waste in a system. Additional Next Generation Lean tools will be discussed in a future article in this series. To get started, though, you don’t need an online tool—just red, yellow and green crayons. You’ll find that MCT maps are great for justifying Lean activities as well as tying the impact of those activities to the waste that is eliminated.
The next article will describe a format for applying the MCT metric to an actual operation.
About the Author

Paul Ericksen
Executive Level Consultant; IndustryWeek Supply Chain Advisor
Paul D. Ericksen has 40 years of experience in industry, primarily in supply management at two large original equipment manufacturers. At the second he was chief procurement officer. He then went on to head up a large multi-year supply chain flexibility initiative funded by the U.S. Department of Defense. He presently is an executive level consultant in both manufacturing and supply chain, counting Fortune 100 companies among his clientele. His articles on supply management issues have been published in Industrial Engineering, APICS, Purchasing Today, Target and other periodicals.