Last year was not a good year for expenditures by foreign direct investors to acquire, establish, or expand U.S. businesses. The total was $259.6 billion in 2017, down 32% from $379.7 billion in 2016, according to the Department of Commerce.
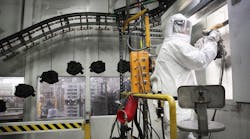
However, manufacturing was at the top of the list of expenditures at $103.7 billion, accounted for 40% of total expenditures, the largest share among major industries.
Within manufacturing, expenditures were largest in food manufacturing ($34.0 billion). There were also large expenditures in information ($25.7 billion) and in real estate, rental, and leasing ($17.0 billion).
Looking at which countries invested the most, Canada was ranked first with expenditures of $66.2 billion, followed by the United Kingdom ($40.9 billion), Japan ($34.0 billion), and France ($23.1 billion). By region, Europe contributed 40% of the new investment in 2017.
And the states which received the largest expenditures were in California ($41.6 billion), Texas ($39.7 billion), and Illinois ($26.0 billion).
Greenfield Expenditures
Greenfield investment expenditures–expenditures to establish new U.S. businesses and to expand existing foreign-owned U.S. businesses–were $6.4 billion in 2017. Total planned expenditures until completion for greenfield investment initiated in 2017, which include both first-year and future expenditures, were $24.8 billion.
By industry, greenfield expenditures in 2017 were largest in manufacturing at $1.6 billion, accounting for 24% of total greenfield expenditures. By U.S. state, greenfield expenditures in 2017 were largest in Delaware ($1.2 billion) and New York ($0.6 billion).
Employment
In 2017, employment at newly acquired, established, or expanded foreign-owned businesses in the United States was 554,300 employees. Current employment of acquired enterprises was 549,700. Total planned employment, which includes the current employment of acquired enterprises, the planned employment of newly established business enterprises when fully operational, and the planned employment associated with expansions, was 577,200.
By industry, accommodation and food services accounted for the largest number of employees (255,100), followed by manufacturing (109,000) and administration, support, and waste management services (55,500). By country of UBO, France accounted for the largest number of employees (47,700), followed by the United Kingdom (42,100) and Canada (39,400).
Breaking down the number by states, Virginia was in the largest employment category, but the employment value is suppressed due to confidentiality. The next largest states in employment were Missouri (63,000), California (55,700), and Florida (55,500). Employment for acquired entities that operate in multiple states is attributed to the state where the greatest number of employees are based.


