Outsourcing the Manufacturing Balance Sheet -- A Slippery Slope
I’ve been working in and around outsourced manufacturing for a lot of years now, so long in fact that I remember when it was simply referred to as “contract manufacturing.” Back then most contract manufacturing was a bit less strategic, less all encompassing, and certainly less politically charged than is the differently named same concept that today is labeled as outsourced manufacturing. And much as the name has changed, so too has the economic and strategic rational that is driving many OEMs in the design, implementation and ongoing management of their outsourced manufacturing activity. But before we come full circle on the title of this article, let us first take a look back at the basic evolution of contract manufacturing and how we have arrived in the outsourced world of today.
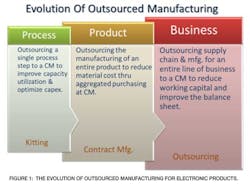
In the early days of contract manufacturing, the primary motivation for outsourcing was the OEM’s desire to achieve peak factory loading. Vertically integrated OEMs would outsource overflow capacity of a single process or set of processes to a Contract Manufacturer (CM) so that they could run their own factories at near peak capacity and eliminate some incremental capital expenditures on plant and equipment. This early outsourcing evolved into the turnkey outsourcing of the production of entire products to leverage the CM’s ability to aggregate material spend and drive a lower product cost. Eventually, outsourced manufacturing – at least for some companies – developed into the asset-light model of relying broadly on external manufacturing service providers to perform all of the supply chain and manufacturing functions that were once an integral part of the firm.
As OEMs have embraced a broader, more holistic set of outsourced manufacturing services, their balance sheets have reaped the benefits of jettisoning those assets traditionally associated with the “M” in being an OEM – namely (1) property plant and equipment for manufacturing, and (2) material and product inventory. Although most OEM executives would strongly argue the tremendous financial merits of their new, “outsourced balance sheet,” the improved Return on Assets (ROA) these OEMs enjoy often comes at a price. The outsourcing of major components of the balance sheet has led to a broad decoupling of the ownership of these assets from the returns that these assets have traditionally earned, creating significant tension and goal misalignment in the supply chain.
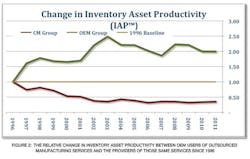
Let’s look at a few statistics here as we examine the impact of the outsourced balance sheet. First we’ll look at Inventory Asset Productivity (IAP) which is a measure of the financial productivity of a firm’s inventory. In 1996, the average Inventory Asset Productivity (IAP) of the electronic product OEMs that we follow as a proxy for the overall industry was 3.66. This means that these firms on average earned $3.66 of gross margin for every dollar of inventory they held on their balance sheets. Fast forward to 2011 and the average IAP for the same proxy group has doubled to 7.30.
Now let’s compare that to the Inventory Asset Productivity of the CMs; those firms to whom the manufacturing portion of the balance sheet has been progressively outsourced. In 1996 the average IAP of the CMs in our industry proxy group was 1.53, meaning that they earned on average $1.53 in gross margin for every dollar of inventory on hand. Today the IAP for that same proxy group is a scant .53.
To really put this into perspective we need to look at the relative changes in IAP for the two groups over the time period. In 1996 the ratio of IAP of OEM users of manufacturing outsourcing to the IAP of the CM providers of outsourced manufacturing services was roughly 2.4 to 1. Today, as the outsourced balance sheet has become virtually the norm for most major electronics OEMs, the ratio of IAP between outsourcing users and outsourcing providers has risen to an alarming 13.8 to 1.
Inventory Asset Productivity Stagnates
For the OEM readers, I’m sure that this dramatic improvement in asset productivity seems to be an attractive potential source of shareholder value creation. So what if the contract manufacturers earned just 7% of the gross margin dollars per inventory dollar as we do – that is the model that they have chosen, right? Perhaps, but the problem for all electronics industry participants lies with the fact that inventory asset productivity in the overall electronics supply chain has not improved appreciably over the past 15+ years. Simply moving inventories from one balance sheet to another should not be confused with supply chain innovation.
During the period shown in figure 1 above where CMs saw their inventory asset productivity drop by some 65%, these same CMs simultaneously saw the level of inventory assets on their books increase a staggering 10 fold. The net effect of this stagnant inventory productivity is bad news for OEMs in several ways, the most concerning of which is in the behavior, performance and risk tolerance it creates in the contract manufacturing industry which produces about 55% of the world’s electronics.
Let’s look at a simple example to illustrate the problem. An electronics OEM, Acme Products, is launching a new wireless widget into the market and is expecting a very high level of demand. The company earns roughly 50% gross margin on the product and is hoping to take share from an OEM rival that offers a competing technology. So Acme products gives its contract manufacturing provider a forecast for 1M units a month, not wanting to leave any 50% margin demand unmet. But the CM does not earn 50% margins it’s gross margins are just 8% so it is a bit more cautious about driving inventory levels to meet upside demand. The CM has learned a thing or two about inventory assets over the past few years: (1) the only way to earn a high ROIC and keep investors happy (despite low margins) is to have a high asset velocity – so inventory must move quickly, and (2) OEMs tend to systemically “overdrive” demand signals to their CM partners because any excess inventory tends to stay on the CM’s books for an extended period of time.
So on one hand we have an OEM that can potentially earn $7.30 of incremental gross margin dollars by adding $1.00 of inventory, with each additional gross margin dollar flowing proportionally more money to the bottom line than the previous dollar. On the other hand, we have the average CM that has the potential to earn an additional $.53 in gross margin for every $1.00 of incremental inventory – but who also has the risk of driving their primary financial metric, ROIC (or ROWC), down by 40% by being wrong on the upside and accumulating slower moving inventories. This dramatic goal misalignment between OEMs and CM is a direct result of the outsourcing of the balance sheet and the decoupling of inventory assets from the high level of return those assets are intended to provide. If you are an OEM trying to grab market share with an innovative new product, who do you want determining your inventory levels?
Ron Keith is chief executive officer for Riverwood Solutions, a supply chain consulting and managed services firm.
About the Author
Ron Keith
Chief Executive Officer
Ron Keith brings more than 24 years of operations experience to Riverwood Solutions including engineering, manufacturing and executive management positions at Westinghouse, Wavetek, Rockwell, Alcatel and Flextronics International. Ron has a reputation as an innovator, team builder, creative problem solver and strategic thinker who delivers straight talk and strong results to Riverwood's clients. He has run international EMS operations with annual sales in excess of $1.4B and has managed manufacturing, product development, and program management personnel in numerous countries.
Ron has advised more than four dozen companies on their manufacturing operations, supply chain, and outsourcing strategy including more than a dozen Global Fortune 500 companies. He has previously consulted for four of the top 10 EMS (Electronic Manufacturing Services) companies and has advised hedge funds, private equity funds and strategic investors on a number manufacturing services related investments. Ron has published more than 30 articles on various manufacturing, technology and business related topics including strategy, operations, quality management, technology trends, and supply chain management.
Prior to founding Oreamnos Partners and Riverwood Solutions, Ron served as Vice President and General Manager at Flextronics International, where he started and ran several divisions in both the EMS and ODM (Original Design Manufacturer) spaces during his more than eight year tenure. He worked with, and ran manufacturing operations for, a number of leading OEMs at Flextronics including Cisco, Motorola, JDS Uniphase, Nortel. W.L. Gore, Kyocera and others.
Ron has undergraduate degrees in both Electronic Engineering and Manufacturing. He received an MA in International Management and an MBA in Operations Research from the University of Texas at Dallas, where he also completed the majority of coursework towards a Ph.D. in Organization, Strategy & International Management (OSIM).


