When you tackle a research topic as big as quality, reams of data are bound to result. When that research spans the globe, those reams of data grow into mountains.
The American Society for Quality is sitting atop that mountain of data, with a lot of data interpretation still ahead of it. Nevertheless, at its annual world conference in May, the quality organization released a small taste of the overall research in the ASQ Global State of Quality Research: Discoveries 2013. ASQ Chief Executive Paul Borawski described the research as “a groundbreaking initiative that identifies quality successes and opportunities from around the world.” Further reports are due in July and November.
Nearly 2,000 organizations from 22 countries provided input to the initial release of findings, which focused on the use of core quality practices. They provide a “current state” view of quality management and metrics use.
“It’s just the beginning of the discussion,” says Travis Colton, senior consultant for the American Productivity & Quality Center, which is a partner in the research. Colton moderated a panel discussion of the initial findings at ASQ’s world conference, site of the research’s unveiling.
What do the initial data say about manufacturing and its relationship to quality? For a start, in multiple instances they show significant differences in the deployment of quality practices and processes between manufacturing-based and services-based organizations.
For example, manufacturers are far more likely than services-based organizations to employ ISO (International Organization for Standardization) as a quality framework. Indeed, 78% of manufacturing organizations indicated using ISO as a quality framework, compared with 52% of service-based organizations.
Manufacturers Like Metrics
Furthermore, manufacturing organizations are more likely than services organizations to use a whole host of quality metrics, including defects per million (82% vs. 38%), first-pass yield (88% vs. 43%), percent on-time delivery (97% vs. 58%), measures of safety (96% vs. 67%) and internal failures (96% vs. 67%). The question left unanswered in the initial report is why the significant differences in use.
Such discrepancies disappear for metrics such as employee satisfaction and customer satisfaction, in use by more than 90% of both types of organizations.
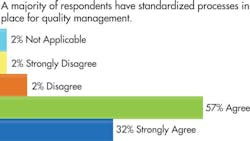
Equally interesting is the low percentage of organizations overall that report having standardized their metrics, meaning the measures have a common definition. For example, only 39.3% of organizations report using a common definition for defects per million and 41.7% for first-pass yield. A common vocabulary seemingly would ease the ability to compare quality performances across an organization or within a department, the ASQ report notes.
“I can’t put a big enough pitch for standardization of metrics,” said panel member Steven Bailey, principal consultant with DuPont’s Applied Statistics Group. “Standardization is just key.”
Ultimately, manufacturing organizations appear more likely than services providers or health-care providers to use quality measures to impact organizational culture. The biggest disparity is in the use of such measures as part of variable performance compensation. While 61% of manufacturing organizations reward employees based on such measures, 34% of health-care organizations do.
A copy of the full report is available for download here.
About the Author
Jill Jusko
Bio: Jill Jusko is executive editor for IndustryWeek. She has been writing about manufacturing operations leadership for more than 20 years. Her coverage spotlights companies that are in pursuit of world-class results in quality, productivity, cost and other benchmarks by implementing the latest continuous improvement and lean/Six-Sigma strategies. Jill also coordinates IndustryWeek’s Best Plants Awards Program, which annually salutes the leading manufacturing facilities in North America.
Have a story idea? Send it to [email protected].

