Manage Pipeline Bandwidth to Avoid Derailing New Products
In the previous articles in this series you learned how to create governance that weeds out low-impact opportunities and to build project plans that are robust to unexpected variation—critical to giving every project an excellent chance of finishing on-time. Once you’ve created this plan, the next step is to schedule your project to move into execution.
I won’t go into all of the reasons here, but did you notice that projects are planned in isolation from the others? Unfortunately, those same projects have to be executed in the real world—a world where multiple projects compete for shared resources.
Every product development organization has a limited or constrained bandwidth—the number of projects it can run at full speed. And letting in more projects than you have the bandwidth for means each of your projects is going to spend time unnecessarily waiting for resources. And that makes every project take longer—much longer.
I lead a workshop exercise using a simulated product development company with a bandwidth of four projects—each lasting six months when resourced at full speed.
If the company respects that bandwidth, they finish 2 projects per quarter, maintain a cycle time of 6 months and deliver a compounded growth in new product cashflow.
However, if they allow just one extra project into execution each quarter, the results are markedly different. With too many projects sharing constrained resources, project durations (cycle time) climb to 22 months and cashflow ends up reduced by about 66% over a 2-year period.
It’s a real eye opener for the executives in this workshop to see the effect on both time and on the P&L. After all, it’s only one measly little extra project per quarter. But the problem is that once you get buried beneath too many projects, it’s hard to get out from underneath them all again.
Of course, I wouldn’t use the simulation if it didn’t match what I’ve seen in the real world. I’ve seen these same kinds of numbers play out in companies in very different industries where projects that normally would have taken 2-3 years were compressed to a year or less when bandwidth was respected.
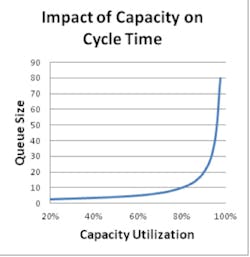
This may feel counterintuitive at first, but not only do you need to respect the pipeline’s bandwidth, you need to stay well below it. Looking at the effect of high capacity utilization rates on waiting times or queue sizes, the graph shows that wait times increase exponentially with capacity utilization. (Reinertsen, The Principles of Product Development Flow, 2009, Celeritas Publishing)
The best way to picture what is going on here is to think about driving home on a downtown freeway late in the evening. If there is a road crew doing overnight repairs with one lane shutdown, how much will that variance add to your travel time?
A minute or two at most—the variance will hardly be noticeable in your overall travel time.
Now, how much longer would it add to your travel time if that same roadwork still has that lane shut down when you return the next morning during rush hour? There’s a pretty good chance you won’t make your 8:00 a.m. staff meeting—the variance is now a much more noticeable percentage of your trip time.
Project Scheduling to Meter Work
It’s only common sense that the more projects underway, the longer everything takes to reach the market. Now we know it makes product development flow less stable and more chaotic too. But with conventional approaches we see this impact ignored over and over again. Without a mechanism to release new projects based on resource availability, it’s easy to let in too many new projects without finishing or pruning the old ones—eventually reaching a point where flow slows down and it’s hard to see any real progress.
The answer is to predictively monitor capacity utilization and then stagger new product starts to keep workload in a target range. You need a system that both tracks the expected workload for your current work but also allows you to evaluate the impact when a new program is proposed.
Whenever a new project is added to the backlog, you evaluate its impact on the portfolio and then set a start date that doesn’t interfere with the flow of projects you are already running—in effect, metering traffic into your execution pipeline.
Here’s one simple way to do that. Let’s say you have the capacity to run five projects at the same time. In that case, you would set a WIP limit of four projects and would only start a new project when one of those four finished.
Why four and not five—because we don’t want to exceed 80% of capacity so that we stay in that robust zone.
Unfortunately, this approach can get complicated unless your projects are all fairly uniform. If you have projects of all shapes and sizes, your capacity utilization can be all over the map. The same thing will happen when projects have highly variable resource loading—for instance when projects have long waiting periods built in for things like long lead time parts and tooling, external certification labs, or even for customer approvals.
So the preferred approach is a dynamic approach where your project planning software does the work monitoring the projected workload. After all, you’ve already included resources in your project plan, so why not take advantage of that information to manage capacity.
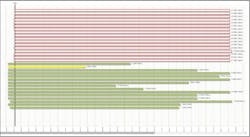
Let’s say that you have a portfolio of already running projects represented in the graphic by the solid green bars. The right end of each bar represents the date each project is expected to finish. The hollow red bars at the top represent your backlog—all the projects you want to run.
Letting all of the projects into execution immediately would overwhelm your resources —and you know that’s not good.
So instead, you schedule the projects into the portfolio by introducing a stagger between the start dates. No worries—this is also something that good project planning software can handle automatically.
The chart below shows the scheduled projects as hollow green bars with their left edges (start dates) pushed or staggered to the right (later in time) to prevent resource overloading.
The projected resource loading charts shows a balanced load with no resource loaded above 80% across the horizon of the portfolio.
Some Pitfalls to Watch Out For
Pitfall #1 Not taking bandwidth seriously - This is one of the most critical steps in the process—this is where your projects meet the reality of shared resources in a multi-project environment. It’s also where they can easily become derailed. Without the right approach to modeling and measuring resource utilization, people will continue to challenge the data and try to ignore the recommendations so their projects can start sooner.
Pitfall #2 Fear of saying no – Some managers don’t like the idea of a backlog. They see it as a sign of weakness vs. the sign of discipline and predictability that it really represents. But more than that, they are worried that customers or internal stakeholders will be upset if we don’t start their project right away. For more on the downsides of allowing too many projects into your pipeline, see this previous article.
The key in responding to these kinds of challenges is to focus them on the project due date instead of when you can start working on it. This becomes much easier as you begin to deliver a dramatically higher number of new products on-time.
This article summarized how to build a robust project plan with a realistically achievable timeline. In the next article in this series, I’ll explain how to schedule work into the execution pipeline at a rate that maximizes throughput by not delaying work already in the pipeline.
Download Mike Dalton’s report "Dealing with New Product Delays… When Throwing Money at It Isn't the Answer" outlining 7 areas for uncovering hidden innovation productivity in your organization. Business leaders can also order a free copy of his upcoming book “Unlocking Innovation Productivity” Proven Strategies that Have Transformed Organizations for Profitable and Predictable New Product Growth Worldwide.
About the Author
Mike Dalton
Managing Director
Mike Dalton is the founder of Guided Innovation Group, where for nearly 20 years he has helped leaders in highly engineered product companies make new products a reliable competitive advantage. He has contributed numerous Industry Week articles and is the author of Unlocking Innovation Productivity and Simplifying Innovation.


