Operator Balance: Why Waiting Is the Worst of the Wastes

It has been established from shop floors, to the warehouses, to the lean forums that overproduction or inventory is the worst of the eight lean wastes. While I certainly can’t argue these are wastes of a devastating consequence if not kept in check, I would like to challenge the experts based on a recent case study. I would argue that the waste of waiting can be as significant as the waste of overproduction or excess inventory and will try and state my case.
I personally hate waiting in all its forms. Ever since I was a child I hated waiting and I still do today as an adult. When I was a kid I hated waiting on Christmas morning to open my gifts or waiting in line at the amusement park. Now that I am an adult I hate waiting in traffic. I hate waiting in the doctor’s office when the nurse tells me he will “be right with me,” only for him to show up an hour later. I hate waiting in line at the grocery store, especially when I see someone writing a check. Heaven forbid they have a stack of coupons!
I also hate waiting on the manufacturing floor. I have been using the operator\machine balancing methodology for many years. The goal of this method is to better understand the time it takes your manpower and machines to make those “things” you sell to your customer. Once you have an understanding of the time it takes to convert your raw materials into finished goods, you try and balance your operator and machine time to eliminate or reduce the waste of wait time among operations.
Calculate Takt Time
Before you even start to break down the steps in your process or pick up a stop watch, you will want to calculate your takt time. Takt time is the measure of how often you need to convert raw materials into a finished good to meet your customer's demand (Available Time/ Customer Demand or AT/CD). It can be expressed in seconds, minutes or hours. How often do you need to produce a part in order to fill your customers order?
Once you have calculated your takt time, it is now the time to hit the line and break down your current- state process. Walk the line from back to front and then from front to back. From a higher level, document all the steps in the process that are needed to convert raw materials to finished goods. Once you have the steps down and you feel confident it is at a level that will give you a sufficient breakdown of your current state, record those steps in a time observation form. You are now ready to begin stop watch observations of your process.
It is critical before you begin time studies on your process that you perform a few critical tasks. First, get your team together for a discussion. You should let them know you are not timing them in effort to get them to go faster; you are simply documenting how long it takes to perform a specific task. You also want to let them know they should “work at their normal pace.” It is natural to see a little Hawthorne effect here. Finally, you want to have your team establish clear start and stop points for the tasks you will be performing time studies on. This will save a lot of headaches later when you have different people gather different samples of the same process steps. Each observer will most likely have a different opinion of when to start the clock and when to stop the clock (we actually proved this out performing a Gage R&R). You are essentially establishing standard work for how to do your time studies. If standard work can be applied to the manufacturing process, it can surely be applied to the lean process!
To this point I hope you are beginning to see where I am going with the crazy claim that waiting is the worst of the eight wastes. Once you have performed a minimum of 10 individual time samples for each of the process steps (20 is even better and will put you in a higher percentage to trust your average for process capability purposes), you are ready to build you operator balance graphs.
I use just a basic excel stacked bar graph, stacking the tasks by the total number of operators in the cell. Each operator is given the total time they perform on a single cycle. This is represented by the stacked bar with each color of the bar indicating a different step. You do this exercise for your current state first to see where your opportunity is.
In the example shown below (which is from an actual recent project) you can see we have eight operators in a line who are not evenly balanced in regard to each of their repeatable work content in a given cycle. The amount of time between the operator with the least amount of work content and the operator with the most amount of work content is exactly four minutes. The calculated line balance of this eight person line was an unimpressive 64%.
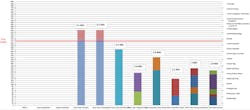
After seeing the current state balance on paper (which was also obvious when you observed the line in action), the team decided that it would be best to run two separate three operator lines instead of one eight operator line. The goal was to set up a better balance between fewer operators in multiple lines. By doing this we knew we could increase our takt time (doubling our available time through the creation of a second line), reduce the number of total operators needed and greatly reduce the waste of waiting between operators through better line balancing.
The following example is what the team came up with. After getting some targeted training and process kaizen we were able to trim time out of the overall process. We could run two lines at a takt time of 10.5 minutes instead of one line with a takt time of 5.2 minutes. Then we balanced the total work content between those three operators to come in under the increased takt time.
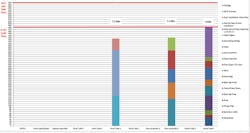
If you look at the second graph, you will see that the amount of time that separates the operator with the most work content from the operator with the least work content is now less than a minute. This also increased our line balance rate from 64% to 93%. The team had taken the total compounded waiting time in the example A from 16 minutes to less than two minutes in example B. That is an 87% reduction in waiting time by the operators. This resulted in a significant 38% increase in output.
By reducing the waiting time of our operators through dual, better balanced lines, we were able to reduce our WIP inventory between operations from several units to one. As far as finished goods inventory goes, most of these units are made to order. By reducing the compounded wait time from example A to that of example B, we clearly reduced the waste of inventory. Although most experts agree inventory is the worst of the eight wastes, in my opinion, the waste of waiting is the worst waste of them all!
Curt Knoll is the former manager of continuous improvement with the Vollrath Company, LLC, located in Sheboygan, Wisc.