Reprinted with permission from "The Journal from Rockwell Automation and Our Partners," copyright 2013 by Rockwell Automation, Inc. and Putman Media, Inc.
Designing human-machine interfaces that take the operator into account — presenting information so operators can see what really needs to be seen — can improve operations significantly.
The connected enterprise revolves in part around big data — the vast amounts of data that will, and in fact, already are coming from manufacturing. Much of the discussion concerns analyzing that data and combining it with business data to create enterprise intelligence. But focusing on the plant floor, analyzing and presenting big data to the operator deserves attention too.
Think back to the early exploration of space. Data from an orbit of the earth or a trip to outer space — which came from computing devices with less capacity than even an early cell phone — was presented on monochromatic screens organized in countless numbers of rows and columns. Deriving useful information from these displays was difficult and tedious, even though they presented much less data.
“Now we have much greater insight into how much information is needed, and therefore higher expectations of what the human-machine interface [HMI] should do for manufacturing activities to function well,” says Jason Wright, PlantPAx™ systems manager at Rockwell Automation.
“Additionally, a new generation of operators is coming on board, and they have different levels of experience and expectations for what a computer system should provide,” he explains. “The quality of the HMI design affects not just the human operator, but also the productivity, efficiency and profitableness of the entire plant.”
Selecting Data to Display
Scott Miller, business manager for visualization software at Rockwell Automation, adds that “end users and original equipment manufacturers must now consciously think about what information should be provided to which person involved on the plant floor so a given display shows only what that person needs.”
Often, screens have been cluttered with data that was useful but not needed at that moment. Considerable human factors research now is being performed to help designers see critical information, and the industry is developing best practices for creating HMIs.
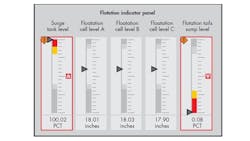
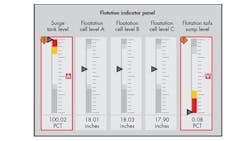
For example, a display designed to help the operator see the most important information first might use colors to help decipher types of data (see graph). Critical issues requiring immediate attention, such as alarms, could be in red to draw the operator’s attention. Real-time operating information might be in black on a light gray background; other information might be in dark gray.
“Important information should be displayed in a way that reflects its importance,” Wright says. “Red can tell the operator immediately that something requires attention and what it is — pressure too high, oven temperature too low or another condition.”
Adding Context
One crucial thing that HMIs must now do “is provide context for the information they present to the operator,” Wright says. “Traditional HMI displays showed values, but with limited information about how the process was changing and what was considered to be within the desirable range.”
In the past, the HMI display might mimic the process, such as showing a drawing of a reactor vessel with multicolored lines coming in and out. But even in muted colors with prominent lines in red, this type of display might not be informative enough.
As an example, imagine a vessel with eight temperature zones, each with its own set point, acceptable operating temperatures, and high and low alarm points — all contextual data. If the 60 or 80 data points are simply superimposed on the vessel or formatted in a table, the operator would have to look up or try to remember all of those points to pick out unacceptable data.
Now, imagine a vertical line for each zone, with the alarm points, the set point, the current operating points and other data marked off on it — eight vertical lines with seven or eight points on each. This is a better display, but the operator still sees a lot of data points and must look up and down each line to check status.
Now draw a horizontal line through the current operating data points on each vertical line. This line immediately shows where on its vertical line each zone is operating, giving the operator data and context in a way that’s very easy to see and use.
Tools to Help
Rockwell Automation has developed a comprehensive library of HMI tools to help OEMs, systems integrators and end-users create pertinent and user-friendly displays that add context to the presentation of process values. The toolkit employs consistent use of color for alarms and indicators that identify abnormal conditions.
These display elements are all integrated with faceplates that allow operators, maintenance and engineers to get the information they need to make smart decisions and perform actions as necessary. Examples include indicators of level that show where the process is heading and graphic indicators that show relationships with other values and operating ranges.
The tools can be used to build displays for both FactoryTalk® View 7.0 and PlantPAx 3.0 Miller says, and are appropriate for both process industries and discrete manufacturing operations.
Rockwell Automation also is working with industry groups such as the International Society of Automation
(ISA) to help controls engineers who are now responsible for incorporating human factors into HMI displays. Standards like ISA 18.2, the recently-formed ISA 101 committee, and the recently released ISA 106 technical report all help define best practices.
“At the core, we want the operator to be more effective by presenting data and enabling that person to interact with it in a more optimal way,” Wright says. “We’re putting a new emphasis on how the presentation of data can impact how an operator functions.”
Making Sense
Today, there’s heavy emphasis on how best to convey information to operators to drive the appropriate reaction and response. The HMI display should make best use, according to industry best practices, of aspects of the display screen’s layout, its look and feel, alarming and alarm management systems, graphics and context, among other factors. This has become important because there’s a much deeper appreciation of how critical the human interaction is to a plant’s profitability and sustainability.

