Cautiousness among manufacturing leaders continues to persist. While there are many signs that 2014 might finally be the year the economy gains some traction, with annual GDP growth of around 3%, there are still reminders that previous years also started with promise only to have such hopes fail to come to fruition.
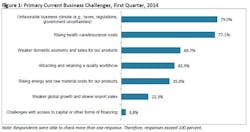
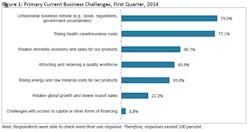
The top business challenge, cited by 79.0% of those taking the National Association of Manufacturers (NAM)/IndustryWeek Survey of Manufacturers, was an unfavorable business climate due to taxes, regulations and government uncertainties (Figure 1). Rising health care and insurance costs ranked second (77.1%), with the issue hovering near the top of this list for much of the past year and a half due to uncertainties surrounding implementation of the Affordable Care Act (ACA). The numbers clearly show that Washington continues to be the major source of the burdens facing manufacturers.
Many sample comments from survey respondents tended to echo these themes, noting ever-increasing regulatory burdens, the need for tax reform and cost increases due to the ACA as well as the need to address the skills gap. One respondent said, “The three biggest drivers [that challenge our business] are an unfavorable business climate, rising health care costs and the availability of a quality workforce. These are driving the weaker domestic economy.” (For a partial listing of comments in this survey, see the end of this report.)
Likewise, roughly 40% of small and medium-sized manufacturers felt that the expiration of these provisions would alter their company’s investment plans for this year. Specifically, manufacturers use this tax provision to replace old or out-of-date equipment (73.9%), add capacity for existing product lines (56.7%) and add new capacity for additional products (50.2%). Additional options mentioned included upgrading technology and enhancing overall efficiency. In addition, at least two respondents said they sold capital equipment, and Section 179 was an effective sales tool for them.
Manufacturers Upbeat About Sales and Production
The weather has dominated headlines over the past few weeks, with dampened demand and hampered shipments reducing overall manufacturing activity in a number of economic reports. To the extent that Americans were not able to venture out to shop or work, retail sales and consumer confidence were also impacted negatively. Manufacturing production dropped 0.8% in January, and sentiment surveys from the regional Federal Reserve banks observed sharp decelerations in new orders and output in their most recent releases. Even the Institute for Supply Management’s Purchasing Managers’ Index, which improved somewhat in February, remains well below the levels seen in the last five months of 2013.
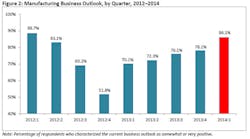
Still, even with the softer data of late, manufacturers remain mostly upbeat about sales and production for the coming months. Weather-related weaknesses are temporary, and the sector grew strongly in the second half of 2013, providing some momentum for this year. Indeed, 86.1% of respondents were either somewhat or very positive about their own company’s outlook (Figure 2). This was the fifth consecutive quarter of acceleration in manufacturer confidence, rebounding since the fiscal cliff debate of late 2012. The outlook figure was up from 78.1% last quarter, with those saying they were somewhat positive rising from 65.9% in December to 72.3% in March, the biggest difference between the two surveys.
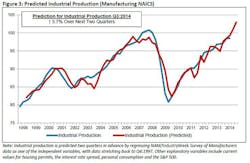
For several quarters now, we have used the NAM/IndustryWeek outlook data in a regression model to predict manufacturing production two quarters ahead (Figure 3). Other variables include current values for housing permits, the interest rate spread, personal consumption and the S&P 500. This model explains roughly 89% of the variation since the data began in the fourth quarter of 1997.What Will Drive Manufacturing Growth?
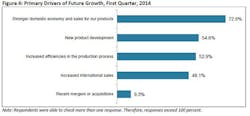
Along those lines, manufacturers see an improving economy (72.8%), new product development (54.8%) and increased efficiencies in the production process (52.9%) as the biggest drivers for future growth (Figure 4). Exports are also vital for a growth strategy, cited by 48.1% of respondents. Over the next 12 months, more than 42% of manufacturers expect their export sales to increase, with another 55% saying their international orders should stay the same. As we have noted in past surveys, those respondents who felt their exports would rise in the coming months were also more optimistic.
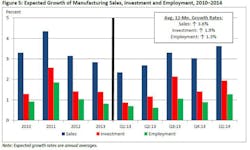
Manufacturers were asked about expected activity over the next 12 months, and given the increase in the overall outlook noted earlier, it should be no surprise that most of the key indicators were higher this quarter than in the previous report (Figure 5). For example, sales are anticipated to grow 3.6% over the next year, up from 3.0% predicted three months ago. Indeed, 71.2% of respondents said their overall sales should increase in the next 12 months, with just 8.2% predicting declines.
Medium-sized manufacturers were the most positive about their prospects for the coming year (expecting sales growth of 4.1%), but larger firms were also quite confident (78.4% anticipating increased sales). In contrast, small businesses (e.g., those with fewer than 50 employees) were the least confident about future orders (expecting 2.8% growth). Yet, all firm sizes were more positive about sales now than in past surveys—a sign of progress.
Hiring Plans Remain Modest
While overall nonfarm employment growth has weakened since December’s survey, manufacturers have added nearly 12,000 additional workers each month on average since August. Respondents plan to increase their employment 1.3% over the next 12 months, up from 0.9% in December. Still, hiring in the sector is growing more slowly than other indicators. Nearly 58% of respondents plan to keep their employment levels constant or to decline. Moreover, the increased hiring appears to be mostly among medium-sized entities, which anticipate 2.1% growth in employment over the next year. In contrast, small and larger manufacturers expect to increase their hiring just 0.5% in the next 12 months.
In a sign that manufacturers might be able to pass on more of their costs, the average price increase anticipated for a company’s product line was 1.5% in this survey, up a bit from the 1.2% change in December’s survey. Meanwhile, employee wages (not including benefits) should grow 1.6%, unchanged from the last report.
The NAM/IndustryWeek Survey of Manufacturers has been conducted quarterly since 1997. This survey was conducted among NAM membership between February 13 and February 28, with 318 manufacturers responding. Responses were from all parts of the country, in a wide variety of manufacturing sectors and in varying size classifications. Aggregated survey responses appear below. The next survey is expected to be released on Monday, June 9.
Comments
- “Cost pressures remain high.” (petroleum and coal products)
- “European continued stagnation.” (transportation equipment)
- “Federal budgets [are a challenge].” (transportation equipment)
- “Finding workers with the required skills.” (machinery)
- “Improvements in housing market after years of minimal activity.” (wood products)
- “Increasing capacity to develop and implement new products.” (electrical equipment and appliances)
- “Potential surge of imports.” (primary metals or fabricated metal products)
- “Prevent further regulatory costs, especially related to the cost for CO2.” (nonmetallic mineral products)
- “Strong growth continues in China.” (transportation equipment)
- “Taxes for Subchapter S-corporations. We can’t compete globally with a noncompetitive tax structure. It’s gotten worse. I’m willing to participate in any way I can to help resolve this issue.” (primary metals or fabricated metal products)
- “The increase in regulatory controls.” (primary metals or fabricated metal products)
- “Tool and die apprenticeship programs needed.” (primary metals or fabricated metal products)
- “Uncertain business climate.” (food manufacturer)
- “We pay 100% of our employees’ health care, family included, and were advised that for the existing policy, we will see a 30–35% premium increase due to the ACA. We will reduce this high-quality plan benefit to something less costly.” (primary metals or fabricated metal products)
- “We were a recent victim of eminent domain and have had to borrow heavily to survive.” (miscellaneous manufacturing)
Survey Responses
1. How would you characterize the business outlook for your firm right now?
a. Very positive – 13.8%
b. Somewhat positive – 72.3%
c. Somewhat negative – 11.6%
d. Very negative – 2.2%
2. Over the next year, what do you expect to happen with your company’s sales?
a. Increase more than 10 percent – 12.9%
b. Increase 5 to 10 percent – 26.8%
c. Increase up to 5 percent – 31.5%
d. Stay about the same – 20.5%
e. Decrease up to 5 percent – 3.8%
f. Decrease 5 to 10 percent – 2.8%
g. Decrease more than 10 percent – 1.6%
Average expected increase in sales consistent with these responses = 3.6%
3. Over the next year, what do you expect to happen with prices on your company’s overall product line?
a. Increase more than 10 percent – 0.3%
b. Increase 5 to 10 percent – 8.9%
c. Increase up to 5 percent – 41.9%
d. Stay about the same – 42.9%
e. Decrease up to 5 percent – 4.8%
f. Decrease 5 to 10 percent – 1.0%
g. Decrease more than 10 percent – 0.3%
Average expected increase in prices consistent with these responses = 1.5%
4. Over the next year, what are your company’s capital investment plans?
a. Increase more than 10 percent – 16.7%
b. Increase 5 to 10 percent – 10.1%
c. Increase up to 5 percent – 15.1%
d. Stay about the same – 45.4%
e. Decrease up to 5 percent – 4.7%
f. Decrease 5 to 10 percent – 0.9%
g. Decrease more than 10 percent – 6.9%
Average expected increase in investment plans consistent with these responses = 1.9%
5. Over the next year, what are your plans for inventories?
a. Increase more than 10 percent – 3.8%
b. Increase 5 to 10 percent – 4.4%
c. Increase up to 5 percent – 15.5%
d. Stay about the same – 52.5%
e. Decrease up to 5 percent – 16.1%
f. Decrease 5 to 10 percent – 5.4%
g. Decrease more than 10 percent – 2.2%
Average expected increase in inventories consistent with these responses = 0.07%
6. Over the next year, what do you expect in terms of full-time employment in your company?
a. Increase more than 10 percent – 2.8%
b. Increase 5 to 10 percent – 9.8%
c. Increase up to 5 percent – 29.4%
d. Stay about the same – 48.4%
e. Decrease up to 5 percent – 5.7%
f. Decrease 5 to 10 percent – 1.9%
g. Decrease more than 10 percent – 1.9%
Average expected increase in full-time employment consistent with these responses = 1.3%
7. Over the next year, what do you expect to happen to employee wages (excluding nonwage compensation such as benefits) in your company?
a. Increase more than 5 percent – 2.5%
b. Increase 3 to 5 percent – 15.6%
c. Increase up to 3 percent – 61.0%
d. Stay about the same – 21.0%
e. Decrease up to 3 percent – none
f. Decrease 3 to 5 percent – none
g. Decrease more than 5 percent – none
Average expected increase in wages consistent with these responses = 1.6%
8. Over the next year, what do you expect to happen with the level of exports from your company?
a. Increase more than 5 percent – 11.9%
b. Increase 3 to 5 percent – 12.9%
c. Increase up to 3 percent – 17.4%
d. Stay about the same – 55.0%
e. Decrease up to 3 percent – 1.3%
f. Decrease 3 to 5 percent – 1.0%
g. Decrease more than 5 percent – 0.6%
Average expected increase in exports consistent with these responses = 1.3%
9. What are the primary drivers of your company’s future growth strategies?
(Respondents were able to check more than one response; therefore, responses exceed 100%.)
a. Increased efficiencies in the production process – 52.9%
b. Increased international sales – 48.1%
c. New product development – 54.8%
d. Recent mergers or acquisitions – 9.3%
e. Stronger domestic economy and sales for our products – 72.8%
10. What are the biggest challenges you are facing right now?
(Respondents were able to check more than one response; therefore, responses exceed 100%.)
a. Attracting and retaining a quality workforce – 43.9%
b. Challenges with access to capital or other forms of financing – 3.8%
c. Rising energy and raw material costs for our products – 39.8%
d. Rising health care/insurance costs – 77.1%
e. Unfavorable business climate (e.g., taxes, regulations, government uncertainties) – 79.0%
f. Weaker domestic economy and sales for our products – 48.7%
g. Weaker global growth and slower export sales – 22.3%
11. What is your company’s primary industrial classification?
a. Apparel and allied products – 0.3%
b. Beverages and tobacco products – 0.3%
c. Chemicals – 6.0%
d. Computer and electronic products – 3.2%
e. Electrical equipment and appliances – 5.4%
f. Food manufacturing – 2.8%
g. Furniture and related products – 0.9%
h. Leather and allied products – none
i. Machinery – 12.0%
j. Miscellaneous manufacturing – 12.6%
k. Nonmetallic mineral products – 1.9%
l. Paper and paper products – 0.9%
m. Petroleum and coal products – 1.3%
n. Plastics and rubber products – 9.1%
o. Primary metals or fabricated metal products – 31.5%
p. Printing and related activities – 1.6%
q. Textile mills or textile products – 0.3%
r. Transportation equipment – 5.7%
s. Wood products – 4.1%
12. What is the size of your firm (e.g., the parent company, not your establishment)?
a. Fewer than 50 employees – 23.1%
b. 50 to 499 employees – 49.1%
c. 500 or more employees – 27.8%
Special Questions: Expired Tax Provisions for Manufacturers
13. Did your company take advantage of enhanced Section 179 expensing or bonus depreciation provisions in 2012 or 2013?
a. Yes – 64.4%
b. No – 24.0%
c. Unknown – 11.7%
Medium-sized respondents only:
a. Yes – 75.7%
b. No – 17.1%
c. Unknown – 8.6%
14. Does the expiration of enhanced Section 179 expensing or bonus depreciation alter your company’s investment plans for 2014?
a. Yes – 35.1%
b. No – 51.9%
c. Unknown – 13.0%
Small and medium-sized respondents only:
a. Yes – 40.1%
b. No – 47.5%
c. Unknown – 12.3%
15. What type of investment was your company making when it used enhanced Section 179 expensing or bonus depreciation? (Check all that apply.)
a. Replace old or out-of-date equipment – 73.9%
b. Add capacity for existing product lines – 56.7%
c. Add new capacity for additional products – 50.2%
d. Other___________
e. Unknown
Special Questions: The Importance of Exports to Your Company’s Sales
16. What percentage of your company’s total sales comes from international markets?
a. Our company does not export. – 12.2%
b. Less than 10 percent – 36.7%
c. Between 10 percent and 19.9 percent – 18.3%
d. Between 20 percent and 29.9 percent – 9.0%
e. Between 30 percent and 39.9 percent – 8.0%
f. Between 40 percent and 49.9 percent – 4.2%
g. 50 percent or more – 11.6%
Average percentage of company sales that come from international markets = 17.3%
17. What are the greatest obstacles that your company faces as it attempts to increase its export sales? (Check all that apply.)
a. Availability of export credit assistance – 9.7%
b. Foreign tariff and nontariff barriers – 47.6%
c. Lack of information on overseas markets – 30.0%
d. Limited resources to pursue new trade opportunities – 46.3%
e. Protection of intellectual property rights – 30.4%
f. Other___________
About the Author

Chad Moutray
Chief Economist, National Association of Manufacturers
Chad Moutray is chief economist for the National Association of Manufacturers, where he serves as the NAM’s economic forecaster and spokesperson on economic issues. He frequently comments on current economic conditions for manufacturers through professional presentations and media interviews and has appeared on various news outlets. In addition, he is the director of the Center for Manufacturing Research at The Manufacturing Institute, the workforce development and education partner of the NAM, where he leads efforts to produce thought leadership, data and analysis of relevance to business leaders in the sector.
Prior to joining the NAM, Mr. Moutray was the chief economist and director of economic research for the Office of Advocacy at the U.S. Small Business Administration from 2002 to 2010. In that role, he was responsible for researching the importance of entrepreneurship to the U.S. economy and highlighting various issues of importance to small business owners, policymakers and academics. In addition to discussing economic and policy trends, his personal research focused on the importance of educational attainment to both self-employment and economic growth.
Prior to working at the SBA, Mr. Moutray was the dean of the School of Business Administration at Robert Morris College in Chicago (now part of Roosevelt University). Under his leadership, the business school had rapid growth, both adding new programs and new campuses. He began the development of an M.B.A. program that began accepting students after his departure and created a business institute for students to work with local businesses on classroom projects and internships.
Mr. Moutray is the vice chair of the Conference of Business Economists, and he is a former board member of the National Association for Business Economics, where he is the co-chair of the Manufacturing Roundtable. He is also the former president and chairman of the National Economists Club, the local NABE chapter for Washington, D.C.
He holds a Ph.D. in economics from Southern Illinois University at Carbondale and bachelor’s and master’s degrees in economics from Eastern Illinois University. He is a Certified Business Economist™, where he was part of the initial graduating class in 2015.
In 2014, he received the Outstanding Graduate Alumni Award from EIU, and in 2015, he accepted the Alumnus Achievement Award from Lake Land College in Mattoon, Illinois, where he earned his associate degree in business administration. He serves on the external economics advisory board for the SIUC’s School of Analytics, Finance and Economics.
