NAM/IndustryWeek 2013 Q1 Survey: Manufacturers' Prospects Picking Up
While not universal by any means, there have been some signs of increased activity for manufacturers early in 2013. The Institute for Supply Management’s Purchasing Managers’ Index has risen for three straight months on stronger sales and production data, and the economies of many of our largest trading partners—with the exception of those in Europe—have made some progress in the past few months, which should boost our export numbers moving forward. However, many of the problems illustrated in our last survey continue to persist. Manufacturing production declined 0.4% in January, and many of the regional Federal Reserve Bank sentiment surveys report ongoing weaknesses with new orders, shipments and especially hiring growth.
Listen to the IW Podcast interview of Chad Moutray
One of the primary challenges noted in the previous National Association of Manufacturers (NAM)/IndustryWeek Survey of Manufacturers was anxiety about the U.S. fiscal situation and the threat of the fiscal cliff. Today, concerns about the long-term fiscal health of the country continue, and many manufacturers have pulled back hiring and investing due to across-the-board federal budget cuts.
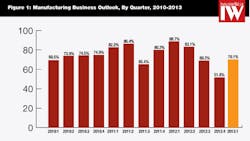
Currently, the U.S. economy is a complicated mix of both progress and enduring headwinds that dampen growth. Optimism remains well below the sentiment level of 88.7%in the first quarter of 2012. Against this backdrop, we observe the current health of the manufacturing sector in the most recent NAM/IndustryWeek Survey of Manufacturers. The percentage of manufacturers with a positive outlook declined significantly throughout 2012, falling from 88.7% in March to roughly 52.0% by December. The percentage of respondents reporting a somewhat negative outlook nearly tripled in the second half of the year, increasing from 15.8% in the second quarter to 38.9% in the fourth quarter.
In the first quarter 2013 survey, the percentage of manufacturers who were either somewhat or very positive about their own company’s outlook rose from 51.8% to 70.1% (Figure 1). This essentially returns the level of optimism back to the third quarter 2012 levels from six months ago.
Breaking it down further, 60.5% of respondents said they were somewhat positive in their outlook, with 28.2% answering somewhat negative. Each of these figures represents a change from the last survey, suggesting a gain in optimism in the past three months. However, as we mentioned previously, the current sentiment levels remain well below what was seen one year ago, when 88.7% of manufacturers were positive and, on average, they expected to see a 5.0% growth in sales.
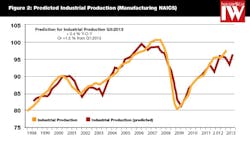
These findings reflect the projected 1.5% increase in manufacturing production over the course of the next six months (Figure 2). A regression model using the NAM/IndustryWeek outlook measure, housing permits, the interest rate spread, real personal consumption and the S&P 500 attempts to predict production two quarters ahead. It explains roughly 90% of the variation since the data began in the fourth quarter of 1997. These findings show an improvement from the last survey, which predicted consistently declining production due to increased uncertainty and pullbacks in hiring and capital spending.
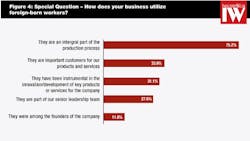
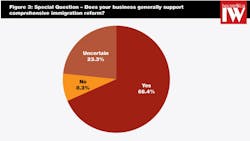
We asked several special questions regarding immigration reform in this survey. The desire to pass comprehensive immigration reform has come into increased focus since the election. More than two-thirds of those responding to questions on the topic said they supported comprehensive immigration reform (Figure 3). Manufacturers rely on foreign-born workers for numerous tasks, ranging from leadership roles to R&D to production (Figure 4). In fact, nearly 12% noted that their businesses were founded by immigrants, with almost 28% having immigrants as part of the leadership team. Additionally, 31.1% of the respondents cited foreign-born workers as instrumental in the innovation and development of key products and services for their company, and three-fourths described immigrants as integral to the production process.
The role of immigrants varies greatly in the manufacturing industry, but many individuals mentioned the need for improved science, technology, engineering and math (STEM) workers in their businesses. For those respondents who volunteered a comment in the special question section on the roles of foreign-born workers in their companies, a number of them wrote computer programmer, engineer, R&D, structural designer, or similar occupations. Others listed responsibilities such as accounting, clerical, loader operator, management, sales/marketing and truck driver. A few comments focused on the challenges related to obtaining a visa for their immigrant workforce, necessitating the need for reform.
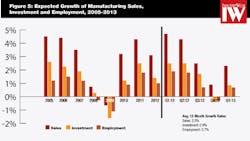
New orders typically drive higher optimism, and roughly 55% of respondents to this survey expect higher sales in the next 12 months, up from 45% in the fourth quarter of 2012. Additionally, almost one-third of those predicting increased orders anticipate growth of 5% or more. At the same time, a sizable percentage, 28.2%, expect sales to remain the same, with 16.5% forecasting declines in new orders.
Even more respondents—roughly one-half—expect their levels of capital spending and hiring to stay the same over the next year. But, approximately one-third of respondents feel that their investment and employment will increase. Again, this marks notable progress from the last survey, when manufacturers intended to pull back on each in light of slowing global sales and concern about the fiscal cliff.
On the labor front, manufacturers expect average wages to rise 1.5% over the next 12 months, up from 1.1% reported in the December survey. Perhaps coincidentally, this matches the pace predicted for price increases for final goods. Three-quarters of respondents said they plan for employee wages, not including benefits, to increase up to 5.0 percent, with another 22.3% anticipating no change in their wage rates.
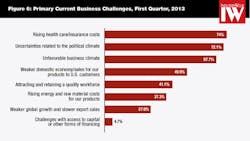
While this growth does not include benefits, 74% of respondents cited rising health care and insurance costs as their top business challenge (Figure 6). This issue has risen up the rankings in the past year, particularly with double-digit increases in premiums in 2013 and more firms beginning to contemplate how the Patient Protection and Affordable Care Act will impact their businesses.
Manufacturers said they expected inventories to shrink by 0.1% on average this year, just barely below unchanged. This marks the third consecutive decline since June, as businesses planned to shrink their inventories in both September and December. However, businesses were not pulling back on their stocks of inventories as much as they were three months ago. In the last survey, inventories were expected to fall by 1.5%.
The international front also showed marginal progress, but significant headwinds remain. In the last survey, respondents anticipated export sales to increase 0.7%. That has risen somewhat to 0.9% in the current survey, with roughly one-third of respondents forecasting higher exports in the next 12 months. More than 57%, however, do not expect their foreign sales to increase this year. The slowdown in the global economy has impeded manufacturing over the course of 2012, but the past couple of months have shown some signs of improvement.
Looking ahead, almost 45% of respondents view increasing international sales as a primary driver of future growth (Figure 7), with many of them becoming more proactive in their efforts. As we have seen in previous surveys, firms expecting to see higher exports in the coming year are significantly more positive in their outlook than those anticipating no change or declining export sales. More than 84.0% of manufacturers planning for increased exports have a positive outlook, compared to just 63.3% for those who did not.
Also consistent with past surveys, results varied by firm size. In this survey, larger manufacturers (e.g., those with 500 or more employees) were more positive than their small (those with less than 50 employees) or medium-sized (50 to 499 employees) counterparts. Three-quarters of large businesses were positive in their outlook, versus 70% for medium-sized and 65.6% for smaller manufacturers. The largest factor explaining this difference was sales, with large manufacturers forecasting sales growth of 3.5% on average over the next year. That drops to 2.3% for medium-sized and 1.2% for small manufacturers.
The more-optimistic sales predictions for large manufacturers carry through into other variables, as well. Larger businesses plan to increase their capital investments by 2.6% this year. In contrast, small and medium-sized manufacturers plan to invest more minimally over the course of the next 12 months, up just 0.4% and 0.25%, respectively. Nonetheless, the one area where size does not appear to matter much was in employment growth. The average hiring growth rate ranges from 0.6% to 0.8% for all size classes, suggesting slow growth in hiring overall, with smaller manufacturers more likely to say their employment levels would stay about the same.
As noted earlier, 74% of responding manufacturers listed the rising costs of health care as their top challenge (Figure 6). Following closely behind at 72.1% was political uncertainties. This consistently high number suggests that political frustrations remain a major concern, especially with across-the-board federal spending cuts and the need for long-term fiscal solutions. Other top challenges included the U.S. tax and regulatory climate (67.7%), weaknesses in the domestic economy and sales (49.9%), and attracting and retaining a quality workforce (41.1%).
The comments further echoed some of these points, as seen in the sample following this analysis. Commenters mentioned issues including political issues such as defense sequestration, the medical device tax, rising health insurance costs, the desire for low-cost energy supplies and the need for tort reform. One manufacturer said that U.S. debt levels were “unsustainable.” But, respondents also commented on the international trade front, including challenges with intellectual property protection, exchange rates and global competition in general. Overall, manufacturers see a stronger U.S. economy as their principal driver of future growth, cited by nearly two-thirds of respondents (Figure 7).
The NAM/IndustryWeekSurvey of Manufacturers has been conducted quarterly since 1997. This survey was conducted among the NAM membership between February 15 and 28, 2013, with 366 manufacturers responding. Responses came from all parts of the country, in a wide variety of manufacturing sectors and in varying size classifications. Aggregated survey responses appear on the following pages. The next survey is expected to be released on Monday, June 10, 2013.
Sample Comments
Selected comments on the biggest challenges facing manufacturing right now. Industry of respondent shown in parentheses.
- “Continued access to domestic, economical energy sources due to the need for additional infrastructure (pipelines, refinery capacity, power generation and grid maintenance)” (Paper and Paper Products)
- “Counterfeit products from China” (Chemicals)
- “Defense sequestration” (Primary Metals or Fabricated Metal Products)
- “[Due to the Affordable Care Act, the imposition of a] medical device tax of 2.3 percent off the top” (Primary Metals or Fabricated Metal Products)
- “Emotional-political, rather than factual, response to developing domestic energy supplies” (Machinery)
- “Foreign competition from China and Vietnam” (Plastics and Rubber Products)
- “Health insurance costs are the biggest concern.” (Primary Metals or Fabricated Metal Products)
- “Lack of tort reform” (Transportation Equipment)
- “Need job candidates that have a strong mechanical aptitude” (Primary Metals or Fabricated Metal Products)
- “Trying to find a good reason to invest” (Plastics and Rubber Products)
- “Unsustainable U.S. debt” (Primary Metals or Fabricated Metal Products)
- “Value of the dollar resulting in reduced international sales” (Machinery)
Survey Responses
1. How would you characterize the business outlook for your firm right now?
Very positive—9.6%
Somewhat positive—60.5%
Somewhat negative—28.2%
Very negative—1.6%
2. Over the next year, what do you expect to happen with your company’s sales?
Increase more than 10 percent—10.1%
Increase 5 to 10 percent—21.1%
Increase up to 5 percent—24.1%
Stay about the same—28.2%
Decrease up to 5 percent—8.8%
Decrease 5 to 10 percent—5.5%
Decrease more than 10 percent—2.2%
Average expected increase in sales consistent with these responses = 2.3%
3. Over the next year, what do you expect to happen with prices on your company’s overall product line?
Increase more than 10 percent—1.7%
Increase 5 to 10 percent—9.6%
Increase up to 5 percent—33.6%
Stay about the same—49.3%
Decrease up to 5 percent—4.4%
Decrease 5 to 10 percent—0.8%
Decrease more than 10 percent—0.6%
Average expected increase in prices consistent with these responses = 1.5%
4. Over the next year, what are your company’s capital investment plans?
Increase more than 10 percent—10.7%
Increase 5 to 10 percent—9.3%
Increase up to 5 percent—12.6%
Stay about the same—48.2%
Decrease up to 5 percent—7.9%
Decrease 5 to 10 percent—4.1%
Decrease more than 10 percent—7.1%
Average expected increase in investment consistent with these responses = 0.9%
5. Over the next year, what are your plans for inventories?
Increase more than 10 percent—2.7%
Increase 5 to 10 percent—6.0%
Increase up to 5 percent—12.4%
Stay about the same—51.9%
Decrease up to 5 percent—18.4%
Decrease 5 to 10 percent—5.8%
Decrease more than 10 percent—2.7%
Average expected increase in inventories consistent with these responses = –0.1%
6. Over the next year, what do you expect in terms of full-time employment in your company?
Increase more than 10 percent—2.2%
Increase 5 to 10 percent—6.8%
Increase up to 5 percent—22.7%
Stay about the same—52.6%
Decrease up to 5 percent—12.1%
Decrease 5 to 10 percent—2.5%
Decrease more than 10 percent—1.1%
Average expected increase in full-time employment consistent with these responses = 0.7%
7. Over the next year, what do you expect to happen to employee wages (excluding non-wage compensation, such as benefits) in your company?
Increase more than 5 percent—1.4%
Increase 3 to 5 percent —12.8%
Increase up to 3 percent—62.1%
Stay about the same—22.3%
Decrease up to 3 percent—0.6%
Decrease 3 to 5 percent—0.6%
Decrease more than 5 percent—0.3%
Average expected increase in wages consistent with these responses = 1.5%
8. Over the next year, what do you expect to happen with the level of exports from your company?
Increase more than 5 percent—11.4%
Increase 3 to 5 percent—10.0%
Increase up to 3 percent—12.3%
Stay about the same—57.1%
Decrease up to 3 percent—4.7%
Decrease 3 to 5 percent—2.2%
Decrease more than 5 percent—2.2%
Average expected increase in exports consistent with these responses = 0.9%
9. What are the primary drivers of your company’s future growth strategies?
(Respondents could check more than oneresponse, therefore, total responses will exceed 100 percent.)
Increased efficiencies in the production process—55.4%
Increased international sales—44.8%
New product development—57.4%
Recent mergers or acquisitions—10.0%
Stronger domestic economy, sales of our products—65.7%
10. What are the biggest challenges you are facing right now?
(Respondents could check more than one response, therefore, total responses will exceed 100 percent.)
Attracting and retaining a quality workforce—41.1%
Challenges with access to capital or other forms of financing—4.7%
Rising energy and raw material costs for our products—37.3%
Rising health care/insurance costs—74.0%
Uncertainties related to the political climate (e.g., fiscal abyss, pending budget cuts)—72.1%
Unfavorable business climate (e.g., taxes, regulation)—67.7%
Weaker domestic economy, sales of our products—49.9%
Weaker global growth, slower export sales—27.9%
11. What is your company’s primary industrial classification?
Apparel and allied products—0.5%
Beverages and tobacco products—0.5%
Chemicals—5.7%
Computer and electronic products—2.7%
Electrical equipment and appliances—5.5%
Food manufacturing—2.5%
Furniture and related products—1.1%
Leather and allied products—none
Machinery—10.9%
Miscellaneous manufacturing—12.8%
Non-metallic mineral products—1.9%
Paper and paper products—2.2%
Petroleum and coal products—0.5%
Plastics and rubber products—8.2%
Primary metals or fabricated metal products—33.9%
Printing and related activities—2.2%
Textile mills or textile products—1.1%
Transportation equipment—5.2%
Wood products—2.5%
12. What is the size of your firm (e.g., the parent company, not your establishment)?
Fewer than 50 employees—24.2%
50 to 499 employees—50.5%
500 or more employees—25.3%
Special Questions: Comprehensive Immigration Reform
- Does your business generally support comprehensive immigration reform?
Yes—68.4%
No—8.3%
Uncertain—23.3%
2. How does your business utilize foreign-born workers? (Respondents could check more than one response, therefore, total responses will exceed 100%.)
They were among the founders of the company.—11.8%
They are part of the senior leadership team.—27.6%
They have been instrumental in the innovation/development of key products or services for the company.—31.1%
They are an integral part of the production process.—75.2%
They are important customers for our products and services.—33.9%
Click here to listen to IW's podcast with NAM's Chad Moutray
About the Author
Chad Moutray
Chief Economist
Chad Moutray is chief economist for the National Association of Manufacturers (NAM), where he serves as the NAM’s economic forecaster and spokesperson on economic issues. He frequently comments on current economic conditions for manufacturers through professional presentations and media interviews. He has appeared on Bloomberg, CNN, C-SPAN, Fox Business, Fox News, and Reuters television.
Prior to joining the NAM, Dr. Moutray was the chief economist and director of economic research for the Office of Advocacy at the U.S. Small Business Administration (SBA) from 2002 to 2010. In that role, he was responsible for researching the importance of entrepreneurship to the U.S. economy and highlighting various issues of importance to small business owners, policymakers and academics. In addition to discussing economic and policy trends, his personal research focused on the importance of educational attainment to both self-employment and economic growth.
Prior to working at the SBA, Dr. Moutray was the dean of the School of Business Administration at Robert Morris College in Chicago, Ill. (now Robert Morris University of Illinois). Under his leadership, the business school had rapid growth, both adding new programs and new campuses. He began the development of an MBA program that began accepting students after his departure and created a Business Institute for students to work with local businesses on classroom projects and internships.
Dr. Moutray is a former board member of the National Association for Business Economics (NABE). He is also the former president and chairman of the National Economists Club, the local NABE chapter for Washington, D.C. He holds a Ph.D. in economics from Southern Illinois University at Carbondale and bachelor’s and master’s degrees in economics from Eastern Illinois University. In 2007, he was named a distinguished alumnus by Lake Land College in Mattoon, Ill., where he earned his associate’s degree in business administration, and in 2014, he received an Outstanding Graduate Alumni Award from Eastern Illinois University.

