Over the course of the first five entries to this seven-part series, a case has been made for the need of Lean practice to evolve. An industrially proven strategy, metric and process have been proposed to be a central part of that transformation. This article will discuss tools that lend themselves to the practice of Next Generation Lean. Two of them have already been discussed earlier in the series, i.e., Value Stream Mapping and MCT Critical-Path Mapping. The third is a tool based on queuing theory named MPX.
Very few Lean tools exist outside of those that have been around since the 1990s. As has been discussed, the practice of Lean hasn’t changed much since its inception so there was probably not much driving the development of new tools. History has shown that it is human nature to resist change. The phrase “If it ain’t broke don’t fix it” characterizes this tendency. Unfortunately, disciplines such as Lean that fail to evolve become broken even if their regression isn’t initially recognized. Rather, this type of failure manifests itself in a discipline becoming less and less relevant. A lack of new tools should raise an alarm similar to when “the canary in the coal mine” is gasping for breath regarding Lean’s vitality.
Tools are important. If a practice is sound, the use of an effective tool assures practitioners a good shot at satisfying customer needs by standardizing the application of best practices. The consistent results they produce can also be used to create statistically significant proof-of-concept process assessments, which can be important in convincing management of the need to support related initiatives. I’ll talk a bit more about this last point in the next—and final—article of this series.
Tool # 1: Value Stream Mapping
There are a multitude of companies offering both online and desktop-based Value Stream Mapping tools. Every year these companies add new bells and whistles to their products in an attempt to achieve product differentiation. The problem with this is that the over-riding usefulness of a Value Stream Map is the basic documentation it provides—a picture—of information and processing flows. In my opinion most of the additional features—while they may provide a bit of eye-candy to users—add very little if any functionality to a Value Stream Map. To that point, I have yet to see a Value Stream Mapping tool tie targeted processing to either executive level financial metrics or the end-use customer. Just as important, I haven’t seen one that provides any level of sophisticated analysis. What do I mean by this?
Analysis of Value Stream Maps today is for the most part intuitive, i.e., review the current state; identify manufacturing Critical-Path Time (MCT) reduction opportunities; develop associated MCT reduction solutions; and prioritize each solution based on what is hoped to be its impact on reducing MCT as well as its projected ROI. If Value Stream Maps had analysis capability they could also be used to compare the MCT of each potential solution to that of the current state, letting you know up up-front what its impact on MCT would be. This type of analysis is typically done through simulation. Few companies have the budget and expertise to routinely create simulations of the What If changes being considered.
If I were selecting a Value Stream Mapping tool today for my personal use I would focus on a basic product with few features above and beyond the visual basics. The one feature I would include relates to ease of storage and retrieval, including the ability to review “before” and “after” Value Stream Maps side-by-side. You’ll find that these basic products are for the most part reasonably priced and easiest to learn how to use. Butcher paper and Post-It notes may do for someone trying out Value Stream Mapping. But for anyone starting up a full blown initiative—possibly encompassing dozens or hundreds of suppliers—an electronic tool is a wise investment.
Tool # 2: MCT Critical-Path Mapping
I’ll start out by saying I have a financial interest in this tool. My partner Sean Larson and I developed it when we were unable to find an existing product that had the capabilities one of our customers asked for relative to both analysis and in communicating results.
As you learned from the article on Next Generation Lean Metrics, a MCT Critical-Path Map is a visual timeline of what a job experiences as it winds its way through processing:
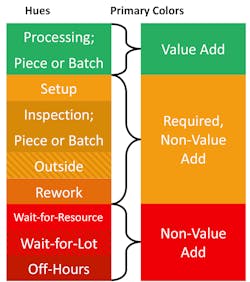
The main difference between MCT Critical-Path Maps and generic maps is that we’ve added different color hues to represent the three main (Green, Yellow, Red) time segment colors. Why is this useful? Because there can be different reasons for the different lengths of a particular color segment and it is important to understand what each represents. For instance if you run a one-shift five-day shop, a significant amount of Red (Non-Value Added—Unnecessary) time will be due to the lack of second and third shifts as well as idle weekends. There are things you can do to address these two issues, for instance, routinely running bottleneck departments extra hours. It is definitely more important, however, to differentiate the portion of Red that is due to scheduled downtimes versus the times due to waiting for resources (man or machine) or waiting for a Lot to finish (remember, MCT tracks the “true” lead-time of the first part in a Lot).
Here is a list of the variation in hues we have set up for our tool (Note: Green has a single hue):
Here’s a comparison of a generic map against a MCT Critical-Path Map employing this differentiated color scheme. I think you can understand how much more useful the second visual is:
We received seed funds from a Fortune 100 OEM for development of this tool and have spent every bit of revenue we’ve generated since then to further its development. A free three-month trial is offered which you can access at www.criticalpathmapping.com. We plan on updates to the tool adding many more features but hope in trying it out you will find the current feature-set is sufficient such that you’ll recognize a MCT Critical-Path Map’s value over more generic MCT Mapping tools.
Similar to Value Stream Mapping, manual approaches like crayons and paper will work for anyone testing out the concept of MCT Critical-path Mapping. However, if you decide to launch a larger initiative you’ll find a more effective tool and platform will be of great value.
Tool #3: MPX
Most people aren’t familiar with Queueing Theory. Put simply, it is the basis for analyzing the competition for resources—both personnel and equipment—needed for processing by a group of jobs with output including job flow-through time. That output sounds a bit like MCT (“true” lead-time), doesn’t it? And whether you realize it or not, everyone has had experiences with Queuing Theory in their everyday life. The following example illustrates this.
Grocery Store Check-Out Lines
The dilemma of selecting the check-out line that will most quickly get you out of a grocery store is something that everyone can probably understand since most of the time—in my experience, anyway—it seems like there are lines at all available cash registers. In deciding which one to join you are conducting a Queuing Theory analysis, albeit an intuitive one. Choosing the quickest check-out line is akin to scheduling at most factories since jobs usually stack up behind needed processing equipment. The only difference is that in a factory the goal is to reduce the average MCT of all jobs—a much more complicated task—while at a store all you are concerned with is your individual check-out time.
If you wonder why more often than not you fail to get in the optimal check-out line it is because Queueing Theory solutions aren’t intuitive. Neither are factory MCT reduction solutions. Queueing Theory can be used to predict MCTs for all the different jobs in your shop under every conceivable scenario. Understanding Queueing Theory and using tools based on it will provide you with a quicker, less expensive alternative to simulations, allowing you to test the impact of your various MCT reduction alternatives.
I’ll now translate the above to a manufacturing example.
The Question of Lot Size vs. Resource Utilization
Shop performance is typically evaluated on the utilization level of equipment and personnel—the higher the better. The reasons for this are financial. For personnel it boils down to whether an employee is hitting their highest practical productivity rate. For equipment it comes down to whether a capital investment is delivering its highest possible ROI. Under today’s Standard Accounting Principles this is how manufacturing effectiveness is usually evaluated.
Production supervisors know how to play this productivity game. Larger lot sizes produce higher machine and manpower utilization numbers. The problem, then, becomes a scheduling one since the longer one job stays on a piece of equipment, the longer others that also need it sit waiting to be processed. In other words larger lot sizes increase the time it takes to satisfy customer demand, i.e., they are anti-build-to-demand.
Academics called this competition for resources dynamic interactions. Production supervisors call it—among other things—snafus! Regardless, the result is longer job MCTs. So tension is created between internal performance metrics and getting product to the customer on-time, as well as all of the associated savings that occur with reduced MCTs.
So where does Queuing Theory come in?
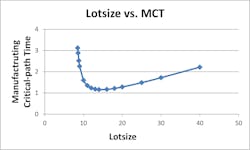
The standard approach to lot size reduction is reducing set-up times. What many manufacturers don’t understand—and what queuing theory reveals—is that when reducing set-up times there reaches a point where the smaller the lot size, the longer—not shorter—the MCT! So, in effect, there is a lot size sweet spot for any specific set-up time which produces the shortest job MCT.
Queueing Theory can evaluate the impact of dynamic interactions on MCT and because of this can identify those lot size sweet spots. It can also help manufacturers understand the best targets for manpower and equipment utilization goals. Goals of 100% utilization are worse than meaningless for markets where error exists in demand forecast since they negatively affect revenues by adding cost and also interfere with a company’s ability to deliver product to customers who are currently willing to pay money for one of their products but may not be willing to wait if it is not currently available.
Requirements
MPX is a tool that—once you define your job and processing set-up—can be used to test What If manufacturing improvement scenarios to understand their probable impact without having to first either develop simulations or actually implement a change to find out how it will do. Baselining MPX to the current state is relatively easy, with input needed from six main areas:
1. General Data—the number of hours per day and the average number of days per year each department in your shop operates.
2. Labor—the job classifications of production employees along with their job skills and availability. To define this you will also need to start with their scheduled hours and subtract when workers are unavailable due to the combined effects of vacation, training, sick days, bathroom breaks, etc.
3. Equipment—defined similarly to labor with machine capabilities and availabilities being the focus. Availability should take into account historic machine breakdown frequencies/durations and/or maintenance schedules and durations. Labor group assignments for each machine type must also be defined.
4. Operations and Routing—this data is perhaps the most detailed model need but is also usually the easiest to come by. If you use MRP or ERP documented routings and processing times you’ll need to verify they reflect actual operations. Tagging data is one way for doing so.
5. Bill of Material—also usually readily available.
6. Demand—reflecting the average production needed over the length of period selected initially in the General Data section.
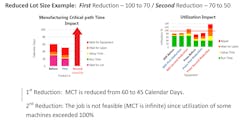
MPX uses this data to determine Machine Utilization, Labor Utilization and MCT for each product and production scenario being evaluated. The following visuals represent just a few typical “before” and “after” results using actual MPX output screens. The product is available for a free trial through the website www.build-to-demand.com. Dr. Greg Diehl—developer of the software—is retired and usually very available to answer questions that may come up with your testing of it. (Disclosure: If you pull up the About Us section on his website you’ll find my name listed. It is there because over the years I have purchased a large number of copies of the software and provided significant user feedback on MPX use. I have no financial interest in MPX itself or its sales.)
MCT changes from infeasible to 15 calendar days due to reduced set-ups and lot sizes. Aggregate of all changes resulted in MCT reduction from 90 to 15 calendar days, an 83% reduction!
As you know from previous articles in this series this size of MCT reduction will have a tremendously positive financial impact. It also would increase the company’s build-to-demand capability, i.e., Lean-ness.
In the next article I will provide a series recap as well as offer some personal observations about the state of Lean.
About the Author

Paul Ericksen
Executive Level Consultant; IndustryWeek Supply Chain Advisor
Paul D. Ericksen has 40 years of experience in industry, primarily in supply management at two large original equipment manufacturers. At the second he was chief procurement officer. He then went on to head up a large multi-year supply chain flexibility initiative funded by the U.S. Department of Defense. He presently is an executive level consultant in both manufacturing and supply chain, counting Fortune 100 companies among his clientele. His articles on supply management issues have been published in Industrial Engineering, APICS, Purchasing Today, Target and other periodicals.


