The Missing Link Between Manufacturing Data and Profitability

At a time when top managers can instantly drill down to any level of data about their finances, sales, customer relationships, supply chain and other functions, one crucial set of data still exists in isolation, separated from the rest of the enterprise by a virtual air gap.
Manufacturing productivity data.
Business intelligence tools built on robust mathematics let corporate leaders see how small changes in any area of their operations flow to the P&L statement. Any area except manufacturing, that is.
Manufacturing and finance people often speak different languages. Plant managers are focused on productivity, but commonly used measurements of productivity aren’t easily connected back to the dollars CFOs use to analyze performance.
Sight Machine has developed a new productivity metric — the Manufacturing Performance Index, or MPI — that lets manufacturers directly link productivity data to profitability. We believe this approach provides the flexibility and ease of use that manufacturers are looking for as they evaluate potential investments, including investments in digitization.
The MPI offers a common language that lets manufacturing and financial executives determine the potential impact on profitability of changes to the production process. And it offers it at the sensor, machine, line, plant and multi-plant level.
A VP of operations overseeing 20 or 30 factories can use MPI to identify which five factories to focus on next year to get the biggest improvement in profitability. Drilling down, MPI can show which four improvements within each factory will lead to the biggest profit boost. For example, increases in MPI and profitability may come from optimizing cycle times across the production processes, improving process yields or reducing the amount of scrap.
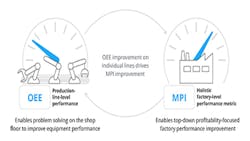
Making OEE Actionable
Manufacturers have historically used a number of metrics to drive performance improvement, with overall equipment effectiveness (OEE) being the most popular. OEE is a foundational metric used for process analysis and root cause problem solving. It measures the percentage of the theoretical maximum productivity that a manufacturing process is achieving, with an equation multiplying quality by performance (speed) by availability (uptime).
OEE = (Quality) * (Performance) * (Availability)
While OEE can be a good measure of the productivity of a machine or production line, it is limited in its usefulness beyond that. It lacks the depth needed to understand manufacturing performance.
Key constraints on using OEE:
- Not directly connected to profitability: OEE is widely regarded as a problem-solving enabler. Most manufacturers are unable to link an improvement in OEE to a direct impact on profitability.
- Hard to measure factory-wide OEE in real time: Due to the difficulties in collecting and tracking data required to calculate OEE, most manufacturers end up measuring OEE once per week or month as an isolated metric on individual lines.
- Focuses on production line performance, not on factory-wide performance: Engineers supporting the production lines are the closest to OEE calculations and they end up using the metric, again in isolation, to drive root cause problem solving only on their individual lines.
Hence, the question is: How can we define a metric that enables measurement of manufacturing performance across a factory, not just on individual production lines, and that links productivity gains to factory profitability?
A Holistic Manufacturing Performance Metric
MPI is an easy-to-understand metric that defines factory performance as a ratio of actual production achieved compared to the maximum production the factory is designed for.
MPI = Actual Production / Maximum Production
MPI is holistic in nature as it measures performance across the whole factory and is able to easily link increases in performance to profitability.
MPI Measurement
MPI can be measured top-down using minimal inputs, or bottom-up as an aggregate of OEE across the whole factory.
The key inputs required for top-down MPI measurement are actual production and maximum (ideal) production capacity. For example, if a factory produces 25,200 units per year, and the maximum potential production is 42,000 units, the MPI is 25,200 / 42,000 = 60%.
Maximum potential production can be calculated using the optimal cycle or batch time, multiplied by the cycles per year. If a best-achievable cycle takes two hours and produces 10 units, and the factory operates 12 cycles per day, 350 days per year, the maximum potential production is 42,000 units per year (10 units per cycle x 12 cycles per day x 350 days = 42,000 units.
MPI can be used as the foundation for evaluating how a range of possible actions will impact profitability.
Sight Machine has built a model that takes the two MPI inputs — actual production and maximum production — and adds a company’s total cost of production, current scrap rate, planned capital expenditure and the volume increase expected from the capital expenditure. The model lets the user change variables to determine the optimal way to capture value.
A version of this model can be accessed via Sight Machine’s MPI calculator, available at sightmachine.com/mpi-calculator/. Sight Machine’s model gathers the following inputs from a client:
- Total manufacturing operating cost
- Actual annual production (parts per year)
- Cycle time per batch (hours)
- Parts per batch
- Number of scheduled shifts per day
- Number of hours per shift
- Number of scheduled working days in a year
- Scrap rate
- Planned capital expenditure
- Volume increase expected from planned capital expenditure
From these inputs, the model calculates MPI, and the expected value capture (in dollars) for every percentage point increase in MPI. Depending on how the MPI increase is achieved, this value capture can result from increasing volume, reducing scrap and/or avoiding capital expenditure.
While the online version of the MPI calculator assumes no variability in labor costs, Sight Machine has also developed an extended version of the model that can factor in savings in labor and overhead costs.
For bottom-up MPI measurement, factories need to have the OEE (for automated steps) or throughput (for manual steps) measured for each step in the production process, identify the process step that is the bottleneck, calculate capacity of the bottleneck process step, and then calculate MPI as a ratio of actual production to capacity of the bottleneck step. (The calculation here is Actual Production /Capacity of Bottleneck Step.)
MPI’s Link to Profitability
Every percentage point increase in MPI can be directly converted to profitability improvement. There are four major sources of value capture that can contribute to profitability improvement as MPI goes up:
- Reduction in unit cost of production: increasing production while holding costs constant lowers the unit cost of production, resulting in overall higher bottom line
- Material cost reduction: reducing the amount of scrap at a factory reduces costs and can also increase output
- Labor and overhead cost optimization: improved production allows factories to better optimize resources required for production either as a result of process improvements or through shift structure optimization
- Avoidance of planned capital investment apportioned for capacity increase: increasing actual production at a factory allows a manufacturer to revisit planned capital investment not only at a given factory but across the whole manufacturing network
Sudhir Arni is director of business development at Sight Machine Inc., whose manufacturing analytics platform uses artificial intelligence, machine learning and advanced analytics to help address critical challenges in quality and productivity throughout the enterprise. Prior to joining Sight Machine, Arni was an engagement manager at McKinsey & Co., where he designed and led manufacturing transformation programs for pharmaceutical and chemical manufacturers. He received joint MBA and Master of Science degrees from the Kellogg School of Management and McCormick School of Engineering at Northwestern University. He can be reached at [email protected].