NAM/IndustryWeek Q1 Survey: Manufacturers Predict Higher Sales, Investment and Employment
Much has been made of the recent resurgence in manufacturing activity. After much slower growth in the middle of 2011, production started to pick up again around October or November. This coincides with manufacturers and the public becoming cautiously more confident in the economy overall, despite a number of persistent headwinds.
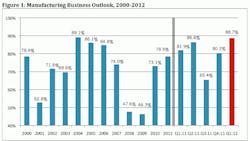
This also was evident in thelast NAM/IndustryWeek Survey of Manufacturers released in December. The percentage of manufacturers who were either somewhat or very positive about their business outlook jumped to 80%, up from 65% in the September survey. Americans had become anxious with developments in Europe, the downgrading of the U.S. credit rating, persistent challenges in the labor and housing markets, and tax and regulatory uncertainties. Indeed, the September figure which had plummeted 20 points in just three months mirrored many other sentiment surveys at the time. As confidence started building, business activity increased, new employees were added and consumers began spending again.
The outlook for growth this year improved with the revival in optimism at the end of last year. I am currently predicting 2.6% growth in real GDP in 2012, which is in line with other estimates. Even with slower growth in the middle of last year, industrial production is up 3.4% in the last year and 9.3% in the last two years. In addition, manufacturers have added 111,000 net new jobs in the past three months, or 425,000 since December 2009. Sentiment surveys suggest higher activity in the coming months as well.
- "Demand by our customer base to reduce selling price due to international competition." (primary metals or fabricated metal products)
- "No talent available. We are all going after the same people." (machinery)
- "Threat of war with Iran; European debt crisis; general uncertainty throughout the world with regard to political issues." (computer and electronic products)
- "EPA, EPA, EPA." (chemicals)
- "Lack of clarity regarding future federal tax policy, regulation and health care mandates." (miscellaneous manufacturing)
- "Health insurance costs and mandates (up 100% in the last two years)." (food manufacturing)
- "Can't go over 50 employees because then medical insurance will be unaffordable. We are at 49 employees now." (primary metals or fabricated metal products)
- "Reducing training costs by drawing from a trained pool of people. Currently we have hired 140 people since 2009 and another 25 people will be added in 2012. We will interview 150 to get 25. Most do not have the basic foundation to enter the manufacturing workforce nor can they pass a drug screen." (primary metals or fabricated metal products)
- "European economic crisis and its possible domino effect." (electrical equipment and appliances)
- "General inflation in cost of virtually all overhead items." (wood products)
- "Cuts in Defense Dept. budgets." (apparel and allied products)
- "Health insurance costs are a huge issue for profitability." (transportation equipment)
About the Author

Chad Moutray
Chief Economist, National Association of Manufacturers
Chad Moutray is chief economist for the National Association of Manufacturers, where he serves as the NAM’s economic forecaster and spokesperson on economic issues. He frequently comments on current economic conditions for manufacturers through professional presentations and media interviews and has appeared on various news outlets. In addition, he is the director of the Center for Manufacturing Research at The Manufacturing Institute, the workforce development and education partner of the NAM, where he leads efforts to produce thought leadership, data and analysis of relevance to business leaders in the sector.
Prior to joining the NAM, Mr. Moutray was the chief economist and director of economic research for the Office of Advocacy at the U.S. Small Business Administration from 2002 to 2010. In that role, he was responsible for researching the importance of entrepreneurship to the U.S. economy and highlighting various issues of importance to small business owners, policymakers and academics. In addition to discussing economic and policy trends, his personal research focused on the importance of educational attainment to both self-employment and economic growth.
Prior to working at the SBA, Mr. Moutray was the dean of the School of Business Administration at Robert Morris College in Chicago (now part of Roosevelt University). Under his leadership, the business school had rapid growth, both adding new programs and new campuses. He began the development of an M.B.A. program that began accepting students after his departure and created a business institute for students to work with local businesses on classroom projects and internships.
Mr. Moutray is the vice chair of the Conference of Business Economists, and he is a former board member of the National Association for Business Economics, where he is the co-chair of the Manufacturing Roundtable. He is also the former president and chairman of the National Economists Club, the local NABE chapter for Washington, D.C.
He holds a Ph.D. in economics from Southern Illinois University at Carbondale and bachelor’s and master’s degrees in economics from Eastern Illinois University. He is a Certified Business Economist™, where he was part of the initial graduating class in 2015.
In 2014, he received the Outstanding Graduate Alumni Award from EIU, and in 2015, he accepted the Alumnus Achievement Award from Lake Land College in Mattoon, Illinois, where he earned his associate degree in business administration. He serves on the external economics advisory board for the SIUC’s School of Analytics, Finance and Economics.
