The Rise of US Income Inequality and the Demise of the Manufacturing Industries

On January 28, 2015, the U.S. Census Bureau reported that some 20% or 16 million of U.S. children receive food stamps. This is roughly a doubling since 2007 when 9 million children, or one in eight, received this form of assistance. Further reports indicate that the overall number of U.S. food stamp recipients has reached close to 50 million.
Now the question must be asked: Is this just another income redistribution instrument in the Federal toolbox or does this really reflect a more alarming feature of the overall U.S. economic picture?
In order to get a better handle on this issue, we need to look into what really goes on in our domestic economy. Normally such analyses start with a look at the real Gross Domestic Product and personal income on a per capita basis, particularly the “real” variety of this much published number. Here the inflation is removed from the overall incomes and values of the net sum of goods and services produced in this country.
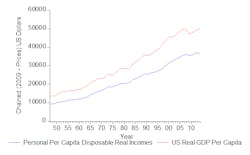
As we can see, on a per capita basis, the size of the economy has more or less consistently increased over last 70 years or so. Thus, as these macro-economic numbers indicate, our national average common incomes have increased even when all inflationary impacts have been taken into account.
Unfortunately, this graphical exposition does not reveal any information on who can buy food and other goods with these annual income flows. The most revealing aspect of Figure 1, however, is the increasing gap between Real GDP/capita and real disposable incomes/capita as time goes by. Most of this gap is due to increasing government, federal, state and local fees and taxes which again pay, i.a., for food stamps.
More revealing, however, are the various private goods and services producing industries’ contributions to the USD GDP as seen in Figure 2.
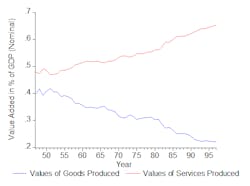
Although some service industries, such as the finance and insurance, are high wage sectors, most other elements in the service industries are notoriously low/minimum wage sectors. The goods producing sectors, mainly the manufacturing industries, have been a steady source of good paying employment for people with or without college degrees. The relative decrease in this element of the national economy means fewer and fewer middle class generating opportunities. A closer look at the manufacturing and finance industries will bring this point to the forefront, as seen in Figure 3.
This graph contrasts the rapid demise of U.S. manufacturing with the slow but steady rise of the financial services sector.
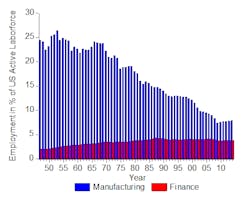
The somewhat increasing relative employment in manufacturing during the last five years is due to a relatively fixed workforce combined with some increases in employment as the manufacturing industries try to get back to its pre-recession levels.
In order to understand why the manufacturing industry has fared so badly it might be of interest to look a bit closer at the post-war economic history of manufacturing.
A Brief Economic History of the US Postwar Economy
The rise of the U.S. manufacturing industries and the rise of the U.S. world military and political might are closely related. From a mostly agrarian nation that mainly attracted immigrants into agriculture and extractive activities, the nation went on, through its own inventions and the rapid implementation of technologies invented elsewhere, to become a major industrial power. By the beginning of the First World War, the U.S. was a force, although somewhat reluctant, to be reckoned with in international contexts.
The basis for this beginning of the U.S. global might was its ability to mass produce industrial and consumer goods on a scale never seen before. At the end of WWII, the U.S. was the world industrial leader both in output and diversity of industries.
As time went on, however, something happened on the way to the promised tide that would lift all boats. First the textile industries found their way to minimum skill countries with cheaper labor. Then the consumer electronic industries started on the same path followed by the auto industry and other high technology industries.
That manufacturing industry jobs are disappearing is fairly well accepted and understood even by the U.S. Department of Labor. In a recent report by the Bureau of Labor Statistics (US BLS), they clearly indicate that this is an ongoing process. This is shown in Table 1.
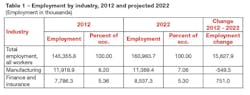
As indicated in Table 1, the U.S. DOL assumes that employment in manufacturing will be reduced by around half a million full-time-equivalent units (FTE) by 2022. The finance sector will increase by about the same number.
This despite that, in late 2010, GM’s CEO, Jeffrey R. Immelt declared to the New York Times that they would start producing stuff here in the U.S. The paper quoted, i.a., “Technology-based manufacturing of all sorts, Mr. Immelt says, has to be a central part of reinvigorating the economy. In speeches and position papers, Mr. Immelt, a member of the White House's Economic Recovery Advisory, has called for doubling manufacturing employment in America, to 20 percent of the work force, which he concedes is an 'aspirational' goal.'" (NYT Business pages, Sunday December 5, 2010).
The U.S. manufacturing sector’s demise can easily be grouped under the banner “The relentless outsourcing years 1976 – present," as seen in Table 2.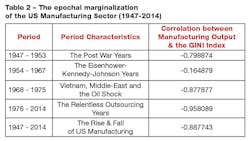
In Table 2, in addition to the epochal definitions, the relationship between manufacturing output and the inequality index (the Gini coefficient/index) for these periods are included. As seen in this table, during the Post WWII, the negative correlation between manufacturing activities and income inequality was relatively strong.
In the next period this relationship quickly dropped as the income and economic welfare of the U.S. middle class improved significantly. As the dormant economic and political dissatisfaction around the World started to affect the structure of U.S. economy, the negative impact on the middle class started to show. This is clearly manifested in the high negative correlation coefficient.
From around 1976 onwards this relationship continued, without exception, to deteriorate. The background for this unfortunate state of the US economy is analyzed further below.
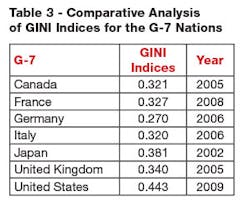
Another socio-economic fact is that among the G-7 the U.S. has the absolute highest Gini index, indicating that its income distribution is decidedly the worst among nations we normally compare ourselves with. Among the G-20, not shown here, only Argentina, Brazil, Mexico and South Africa have worse income distributions than the US. The comparable international Gini numbers can be found in Table 3
In Figure 4, below, the manufacturing industries relative importance (in percent of U.S. GDP) is depicted together with the U.S. Gini Coefficient, a measure of income equality or inequality in the U.S. Here we only need to know that an index of zero (0) indicates that the income distribution is equal in the sense that 1% of the U.S. population earns 1% of the income and 2% of the population earns 2% of the income and so on.
As the index approaches one (1) national income is concentrated on the upper income classes, e.g., 1% of the population earns almost all of the income. It thus reflects economic equality or the lack thereof in the U.S. This index is published by the US DOL/BLS every year (the publication normally lags one year).
Figure 4 somehow seems to point to an inverse relationship between the demise of the manufacturing industries and the worsening of the U.S inequality of income and wealth.
In Figure 4, the Gini index for the period 1947 to 2014 is shown. Here one notices that at the beginning of the period the coefficient is relatively low, i.e., more or less on Western European current levels. During the years after 1980, the U.S. started experiencing sharp increases in the index.
At the same time, U.S. manufacturing started its decline as measured by its value added contribution to the U.S. GDP. By 2014, the U.S. Gini index started to take on Third World dimensions. This precipitous decline in income equality clearly coincides with the demise of US manufacturing’s importance in our economy.
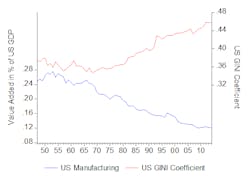
The overall relationship between the two variables shown in Figure 4 on a least square regression basis is some 98.6%, i.e., the GINI index explains2 98.6% of the variation in manufacturing value added during 1947-2014. This does not necessarily prove a cause and effect theory, but a first indication of such an effect. To further look at the issue a quick analysis of the epochal relationship might be in order.
In order to have a closer look at the relationships between the decreases of the economic importance, as measured by a sector -– here manufacturing -- and the U.S. GDP, we will split the above 67 years into the following sub-periods as listed in Table 2.
Again it is important to remember that the lower the Gini Coefficient (Gini index) is the more equal is the income and wealth distribution.
Epochal Rise and Decline of Economic Equality
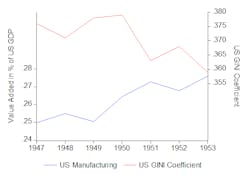
In Figure 5, the initial post-war years are shown. Here manufacturing’s share of U.S. GDP was rising, and the income equality improving in leaps and bounds. The U.S. had come out of the war with a very efficient and diverse manufacturing sector. The U.S. was the source of industrial export to a war-torn Europe, and its might and prestige was without bounds.
In a June 5, 1947, speech to the graduating class at Harvard University, Secretary of State George C. Marshall issued a call for a comprehensive program to rebuild Europe. This program, later known as the Marshall Plan (officially the European Recovery Program, or ERP), was an American initiative to help rebuild the mostly ruined European economies after World War II. Most of the help was in the form of machinery and infrastructural implements.
1947 – 1953: The Post War Years
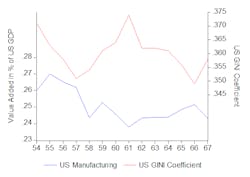
Hence, the wheels of U.S. manufacturing were churning ahead with full speed, and the sector’s share of U.S. GDP rose from around 25.5% in 1948 to 27.6% in 1953. At the same time the Gini index went from 37.6% to 35.9% in 1953. At that point in time, this was the lowest ever recorded.
1954 to 1967: The Eisenhower-Kennedy-Johnson Years
But better times were awaiting the U.S. population, as the middle class and the manufacturing sector expanded, although only in absolute terms. The Gini index, however, remained, on the average, in the 36% to 37% range. In relative terms, the effect of the Marshall Plan had begun to take hold, and German manufacturing was on the rise, particularly TVs, a newcomer on the European scene, and automobiles gradually took over the European markets.
But the socio-economic scene in the U.S. was one of optimism and belief in the future. Carl Perkins and Elvis Presley were, for the most part, only worried about their “Blue Suede Shoes.”
The Cold War was now in full bloom, and the Iron Curtin had fallen along the central European borders. Worrying signs of unrest in the broader world would soon move the public attention from personal apparel to war. An armistice had been reached in 1953 on the Korean conflict. Almost 40,000 Americans died in action in Korea, and more than 100,000 were wounded. Consequently, the U.S. population was in no mood for another major war.
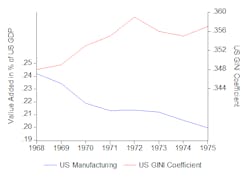
1968 to 1975: The Vietnam, Mid-East and the Oil Shock Years
Unfortunately, another and more devastating war and more international unrest were on the horizon. When the French left Vietnam after the First Indochina War (1946-54), the U.S. stepped in to assist the non-communist cold war proxy fight. This engagement lasted from 1955 to 1975, although American military advisors had been there since 1950. At the end, the total cost in human life had reached to around 58,000.
During the same period, the world oil supply was endangered by the Middle East conflict. As a reaction to the Yom Kippur War, the Organization of Arab Petroleum Exporting Countries (OAPEC) decided in 1973 to instigate an oil embargo on the western nations that sided with Israel. The embargo ended in 1974. The result of this embargo was that global crude oil prices rose significantly (from $3/bbl. prior to the embargo to around $12/bbl. after).
The impact of the global economies was immediate and severe, as the economic structures adjusted to the fourfold hike in energy costs. Structural change takes time and implies both permanent and interim unemployment for large segment of the impacted economies.
Although well-endowed with hydrocarbons, the oil embargo caught the U.S., to a large extent, off guard. Not only did the gas lines at the gas stations become long and tedious, but the various oil consuming industries were suffering. Fortunately, a valuable lesson was, however, learned through this experience: utilize national resources and build up reserves. Although the U.S. income equality index (Gini index) for this period looks dramatic, it is clearly still comparable with what goes on in other industrial nations. The manufacturing industries, however, continued its downward trend as seen in Figure 7.
1976 to 2014: The Relentless Outsourcing Years
As the economic tumults subsided during the late 1970’s and 1980’s, new international trade agreements, both through GATT and bilateral trade agreements were finalized. Additionally, the U.S. managed to get free trade agreements with 20 countries.
Currently the U.S. is in negotiations on regional, Asia-Pacific trade agreement, known as the Trans-Pacific Partnership (TPP) Agreement and the Transatlantic Trade and Investment Partnership (T-TIP) with the European Union. The objective here is the shaping of high-standard, broad-based regional pacts.
On top of this, the U.S. has bilateral investment treaty (BIT) program that helps: to protect private investment, to develop market-oriented policies in partner countries, and to promote U.S. exports. The BIT program's basic aims are to protect investment abroad in countries where investor rights are not already protected through existing agreements (such as modern treaties of friendship, commerce, and navigation, or free trade agreements); to encourage the adoption of market-oriented domestic policies that treat private investment in an open, transparent, and non-discriminatory way; and to support the development of international law standards consistent with these objectives.
Now, one should think these would be powerful tools to enhance the ability of U.S. manufacturing to penetrate most of the world markets for exports. Unfortunately the U.S. manufacturing industries, as shown in Figure 8, have continued their downward trend and, by 2014, these industries’ share of contribution to the U.S. GDP stood at around 12%, down from around 21% when manufacturing outsourcing started in earnest.
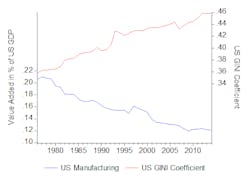
The income and wealth distribution index (the GINI coefficient) has by 2014 reached Third World levels, and there is no improvement insight.
Why did this happen: The Theoretical and Political Arguments
In the political arena, during the diaspora of the U.S. manufacturing industries, there were whispers and murmurs and the occasional silly shows of smashed TVs and cars.
Simultaneously, however, the U.S. participated in the various UNCTAD trade rounds and the more hemispherical NAFTA negotiations. Some political actors heard sucking sounds, but came with no suggestions on how to moderate or restructure the outsourcing phenomenon. There is, however, a strong suspicion that our free trade agreements provided political cover for U.S. companies, particularly the larger corporations, to move production to countries with adequate human skill sets, an economic environment that has lower taxes; and a free trade agreement with the U.S.
Hence, with corporate offices in the U.S. and the production facilities flying a “flag of convenience,” the quarterly reports and bonuses for the leadership started to improve.
As the labor intensive industries relocate to other countries, the opportunities and incomes for large swaths of the homeland population disappear...
Improved bottom lines should, of course, always be the goal of well managed businesses, but the flight of labor-intensive industries has a vicious downward spiral attached to it. As the labor intensive industries relocate to other countries, the opportunities and incomes for large swaths of the homeland population disappear and, unless new needs and wants are created or discovered in the economy, the purchasing power of the remaining population will over time deteriorate.
Ultimately, the leadership so eager to outsource all or a major part of their production may wake up and find themselves in a situation of declining demand for their foreign produced goods.
People in upper income levels, no matter how conspicuous and over the top their consumption may appear, really have a much lower propensity to consume than people in the middle and lower income brackets. Thus, as the upper economic group's incomes increase their consumption of services up to a certain point, but not their consumption of goods except the conspicuous parts.
The opposite is true, particularly for young couples with children. People in the upper 2% income bracket have no such problems, but they do, however, have significant difficulties in finding new profitable real investments for their savings. Hence, we see increased acquisitions of existing businesses and purchases of Treasury and Muni Bonds, but very few daring new projects can be spotted on the investment horizon.
It is not only the political uncertainties holding back investments, but rather that the consuming public is not buying goods, whether domestically or foreign produced, basically because they cannot afford most of the gadgets available in the stores.
Thus, no new production capacities are needed. As discussed above, the U.S. with a Gini Coefficient, our measure of income inequality is now in the 45% range, i.e., already at Third World levels. The comparative Mexican measure stood at 0.482 in 2008.
Since it is highly likely that the bottom of the relative demise of the U.S. manufacturing industries has not yet been reached, it might be worthwhile to take a look at the theoretical and political arguments that got us into the predicament we are in today.
The Theoretical Argument
There are serious and very solid theoretical arguments that can be made for free trade. Adam Smith in his Wealth of Nations (Book IV Ch. IX 20-21) says in his argument against mercantilism and the French physiocrats, whose focus was on agriculture and land development, i.a., that “The most effectual expedient, on the contrary, for raising the value of that surplus produce, for encouraging its increase, and consequently the improvement and cultivation of their own land, would be to allow the most perfect freedom to the trade of all such mercantile nations.”
David Ricardo, an Adam Smith contemporary3, in his book “The Principle of Political Economy and Taxation” introduces the concept of “comparative advantage,” which says that a country should concentrate its production of goods where they are most efficient and then trade with other nations.
This concept was later used in the development of the Heckscher-Ohlin model of international trade published in the 1930's. Later this model was expanded by Paul A. Samuelson, Jaroslav Vanek, Ronald W. Jones and Roy J. Ruffin. These models basically refocused the academic and political discussions of international trade on the economic and social benefits accruing from a free international trade.
The Political Argument
The U.S. is, strangely enough, a late comer to the free trade fraternity. As late as in the 1890's, the U.S. put in place the “McKinley tariff” (a custom duty of almost 50% ad valorem on imported goods) which effectively blocked trade with a large group of nations. It was not until after WWII that the political understanding of the inherent problems with trade barriers started to take hold among the U.S. political class; moved along by the tenets of the Heckscher-Ohlin-Samuelson (H-O-S) model.
As the post-WWII Western economies boomed, the talk of a freer trade led to various changes in the international trade arena; first through an easing of the exchange rate controls, the decoupling of the U.S. dollar from the gold standard, and the European experiment -- starting with the Treaty of Paris and the birth of the Coal & Steel Union, and later the Treaty of Rome -- which established the EEC which later morphed into the European Union (EU). All of these were attempts at free trade between nations of approximately the same level of economic and political development.
Some Rational Caveats
The H-O model is, in Bertil Ohlin's own words4 “a price theory that takes into consideration a multiple of markets” and not an international capital movement theory. In the H-O model, free capital movements are normally assumed and associated with gaining access to markets with high tariff barriers or because portfolio returns, particularly for bonds, were much higher than in the capital exporting economy. Foreign direct investments (FDI) were, however, made to enable the recipient country to afford the new goods produced and not for exports.
Today, enabling the "export only" host countries' consumption of the new goods would, in most cases5, necessarily imply a two-tier price system -- which would be at odds with current international trade agreements.
Thus, the initial premise behind the policies of “free trade” -- and particularly the free capital movement -- was included to enable trade in goods and services and not simply to establish export machines. What we have today is just another implication of the “law of unintended consequences.”
Conclusion: A Close Adverse Relationship...
As the above brief analysis has shown, there is a close adverse relationship between the manufacturing sector and the income distribution in the U.S. The outsourcing of industries cannot continue much longer before we, as an economic entity, will have such a deep chasm between the economic elites and the rest of us that it will not matter how cheap the imported goods are, as most of our population will not be able to afford the gadgets they put on their outlet shelves, be it at Wal-Mart, Target or Costco.
Something has to happen, and we know that it will not and should not come from governments, neither federal, state nor locals.
Something has to happen, and we know that it will not and should not come from governments, neither federal, state nor locals. These institutions will only make things worse and create more unintended and unforeseen contradictions.
The change has to come from our business, particularly the larger ones that have outsourced everything from toilet paper to cloth pins, not to talk about larger high technological machinery and computer components.
In 2010, it did appear as if one of the largest U.S. companies, General Electric, had seen the light. Its CEO, Jeffrey R. Immelt bombastically declared that they would start producing "stuff" here in the U.S.
The New York Times quoted, i.a., “Technology-based manufacturing of all sorts, Mr. Immelt says, has to be a central part of reinvigorating the economy. In speeches and position papers, Mr. Immelt, a member of the White House's Economic Recovery Advisory Board, has called for doubling manufacturing employment in America, to 20% of the work force, which he concedes is an 'aspirational' goal.” (NYT Business Day Sunday December 6, 2010).
The next morning, however, NYT Business Day, Monday, December 6, 2010, reported that during the 2008 financial crisis, the Federal Reserve Bank "essentially lent $16.1 billion to GE by buying short term corporate i.o.u.'s from the company while Mr. Immelt sat on the nine member board of the Federal Reserve Bank of New York." Thus, Mr. Immelt's manufacturing enthusiasm should probably be taken with a handful of salt.
The people that populate the closed political circles, which CEOs of large U.S. corporations operate in, have a tendency to say the right things and do the opposite.
But let's hope that some of them begin to understand the relationships between the decline of the U.S. manufacturing industries, the generally lower disposable incomes and the propensity to consume the products they bring in from Third World countries.
One former U.S. Secretary of Labor lamented -- not so long ago -- that the U.S. population was 20% First World and 80% Third World. As the Gini index numbers indicate, he is unfortunately correct. We are already there; at least as far as the U.S. income distribution is concerned. With 80% of the U.S. population, or around 240 million people, we have a segment of our population that comprises a relatively large Third World country.
Data used in the above article can be obtained from the author.
End Notes
1 US CIA The World Fact Book - Country Comparison to the World - Distribution of family income - Gini index. The number for US 2009 was issued by US Bureau of Census
2 Residual: stationary white noise. (Augmented D-F test -8.579987 < 1% level)
3 Actually Ricardo was 4 years old when Smith's Wealth of Nations was published.
4 Author’s translations from his book (in Swedish) “Utrikeshandel och Handelspolitik”, Natur och Kultur, Stockholm 1965 p.387 "På så sätt blir utrikeshandelsteorin en teori för prisbildningen som beaktar existensen av flera marknader.”
5 Output from the Mexican maquiladoras can be sold in Mexico.